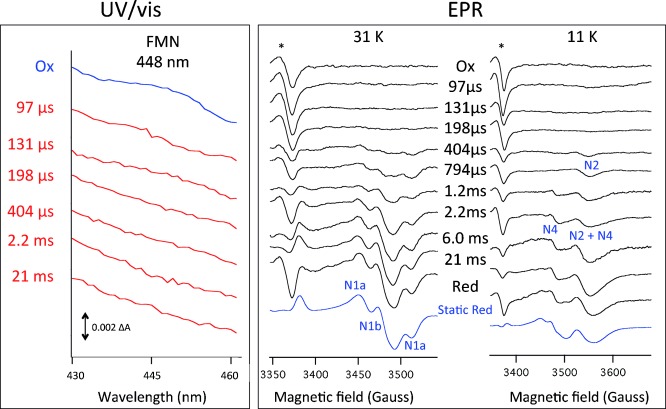
Figure 2.

Low-temperature UV/Vis spectra highlighting the FMN spectral region (left) and EPR spectra (right) of complex I in the presence of piericidin freeze-quenched after different reaction times with 100 mm NADH. The EPR spectra show the gx,gy spectral range of the FeS centers. The asterisks indicate the g=2 radical region and the (variable) contribution due to the freeze-quench procedure. Static red: reduced by NADH and manually frozen. At 31 K centers N1a and N1b are seen, at 11 K centers N2 and N4 are also detectable.
