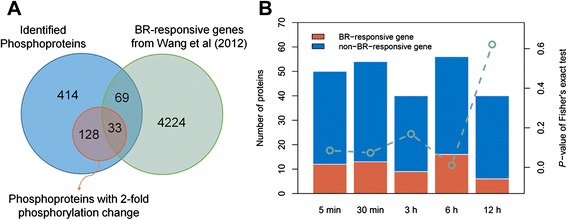
Fig. 7.

Comparison between phosphorylated proteins and BR-responsive genes in transcription level. a The Venn diagram shows the overlap between phosphorylated proteins and BR-responsive genes. b The proportion of significantly regulated phosphoproteins which are also BR-responsive genes (red) and not BR-responsive genes (blue) at each time point is presented by bar plot. The green circle indicates the significance of the proportion of BR-responsive genes which is assessed by Fisher’s exact test
