
Figure 3.
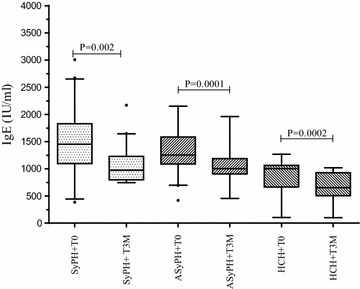
Comparison of changes in median total serum IgE at baseline (before treatment) and at 12 weeks after successful deworming in symptomatic, asymptomatic and health controls. Horizontal lines are medians and interquartile ranges (IQRs) (25 and 75 centile) and the black dot represents outlier values. Keys: Similar to Figure 2