
FIGURE 1.
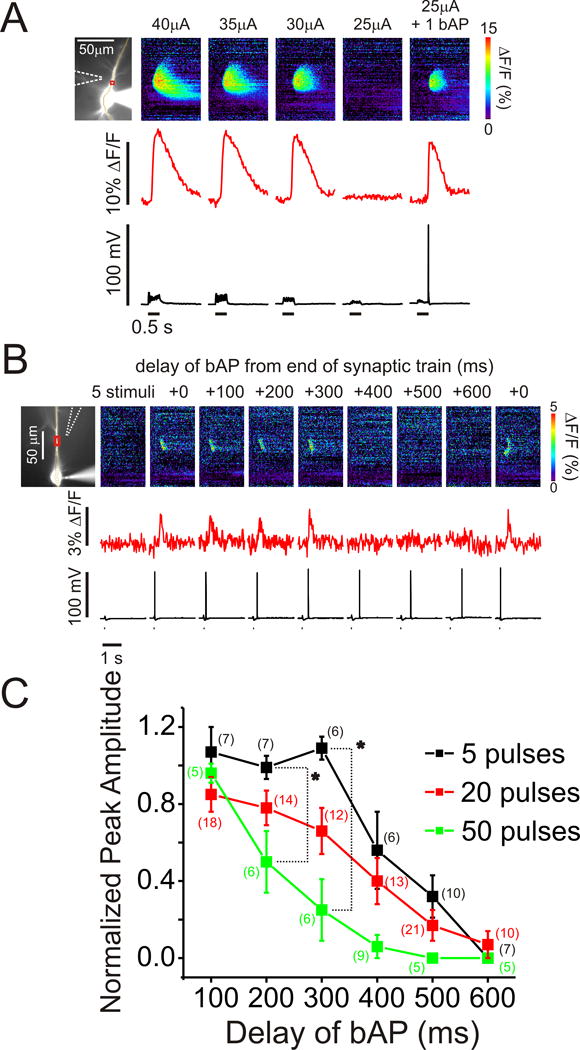
Pairing of repetitive synaptic stimulation and a single backpropagating action potential synergistically evoked Ca2+ release within a timing window that depended on the duration of stimulation. (A, left) cell image showing a pyramidal neuron filled with 500 μM furaptra. The patch electrode is on the soma and the position of the stimulating electrode is shown with a dotted arrow. The set of pixels through the soma and dendrite indicate the position of the ‘line scan’ in the right panels. The boxes indicate the ROIs (regions of interest) in the dendrites from where the individual optical traces were recorded. Right, the series of panels show the fluorescence changes and electrical responses to a series of synaptic stimuli (100 Hz for 0.5 s) at decreasing intensity. The cell was hyperpolarized from -65mV to -75mV to prevent firing. The stimulation intensities are indicated above the pseudocolour images and the threshold current was 30 μA. The optical, electrical and ‘line scan’ panels all have the same time scale. Stimulation using 25 μA did not evoke Ca2+ release, but it was effective when paired with one backpropagating action potential (bAP). Pairing was not necessary at higher intensities. (B) Ca2+ release evoked by a train of 5 stimuli (black dots) and a single bAP. The delay of the bAP from the end of the train was varied from 0 ms to 600 ms. In this experiment release did not occur for delays ≥ 400 ms. (C) The peak amplitude of Ca2+ release as a function of the delay of the bAP from the end of the stimulation train normalized to the amplitude at 0 ms delay. Data from trains of 5, 20, and 50 stimuli are shown. The means of the amplitudes at 200 and 300 ms for trains of all durations were significantly different (P < 0.05, ANOVA).