
FIGURE 3.
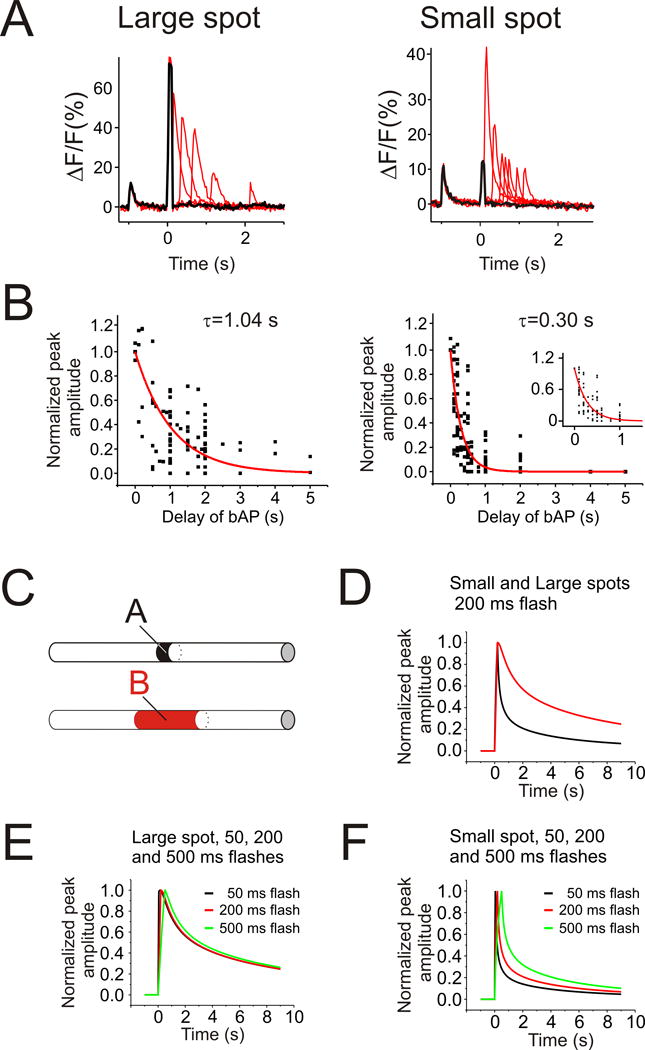
The duration of the timing window depends on the size of the uncaging flash. (A,left) Representative examples of Ca2+ release evoked by a 150 ms large UV spot paired with bAPs at varying delays (thin traces). The thick trace shows only the UV flash artifact and no Ca2+ release. Right, similar examples of Ca2+ release evoked by a 150 ms small UV spot. (B) Normalized peak amplitudes of Ca2+ release evoked by large (left) and small (right) UV flashes as a function the bAP delays. Inset shows the small UV flash data on an expanded time scale. The amplitude of the signal from the bAP evoked before the flash was subtracted from the pairing signal to estimate the Ca2+ release contribution to the amplitude. Traces show single exponential fits to the data points. There was a significant difference between the time constant found using the large and small spots (1.04±0.08 s vs. 0.30±0.18 s). (C) Model comparing the diffusion of IP3 when IP3 is produced over a short or long dendritic segment. A 200 ms bolus of IP3 was produced locally (10 μm segment, A) and widely (50 μm segment, B) in a simulated dendritic branch. (D) Normalized IP3 concentration profiles at points A and B on Fig. 3C. The decay is much slower when IP3 is produced over the longer segment. (E) Normalized IP3 concentration profiles at point B for three different bolus durations. (F) Similar time courses at point A. The duration of the bolus has much less effect than the length of the segment.