
FIGURE 4.
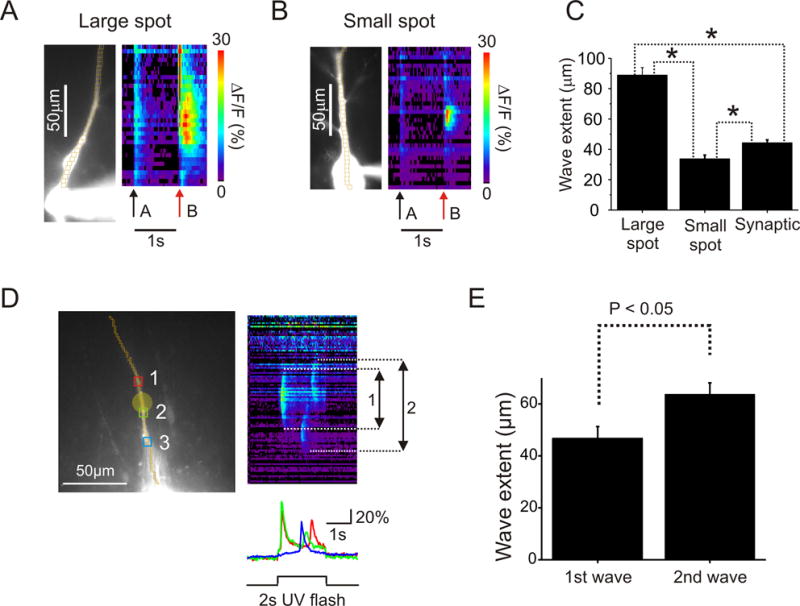
Factors affecting the spatial extent of Ca2+ release waves following uncaging or synaptic stimulation. (A and B) Representative examples of Ca2+ release evoked by pairing large and small subthreshold UV flashes with a single bAP. (C) Average Ca2+ wave extent in three kinds of experiments; large spot: 89 ± 2 μm, n = 5 cells, 12 trials; small spot: 34±2 μm, n = 18 cells, 21 trials; synaptic stimulation: 44 ± 2 μm, n = 3 cells, 31 trials; wave extent measured at 50% of peak amplitude. The three sizes were significantly different but the synaptic size was closer to the small spot size (F (2, 61) = 85.7, P < 0.01, ANOVA). Asterisk shows significance (P < 0.05) by Tukey post-hoc test. In A and B arrows (a) are the times of single bAPs. The arrows (b) are the times of the bAP paired with the uncaging flash. (D) One example of secondary Ca2+ waves generated at the end of a 2 s long uncaging pulse. The secondary waves always extended further along the dendrite. A possible explanation for why two secondary waves were always generated is that the IP3 receptors in the center were desensitized by the high concentration of released IP3 in this region, but we do not have direct evidence to support this hypothesis. (E) Summary histogram of the spatial extents of the primary and secondary waves (n=8).