
FIGURE 7.
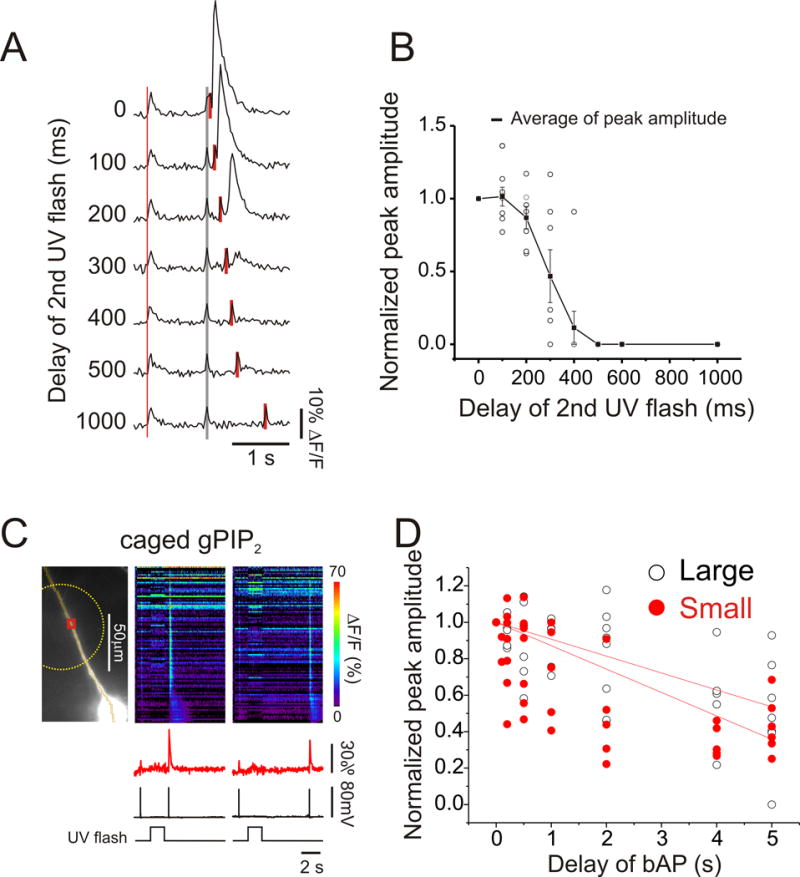
Evidence relating to the importance of the off rate of IP3 unbinding from the IP3 receptor in determining the timing window. (A) The timing window for successful Ca2+ release evoked by pairing two uncaging flashes separated by different times is not different from the window evoked when a single UV flash was paired with a bAP. Representative experiment with paired UV pulses. A single bAP was generated to give a reference signal (thin black line) and 1 s later pairs of 100 ms UV flashes were given with varying delays between them (solid bars). When the delay was 0–300 ms Ca2+ release was observed at the site of the flash but not with longer delays. The very short signals at the times of the flashes are uncorrected artifacts. (B) Summary plot of the data from 10 cells. The average peak amplitude is plotted. The time window was about 300 ms, similar to that determined with a single flash and a bAP. (C) Timing window of Ca2+ release evoked by pairing the uncaging of gPIP2 with a bAP was longer than of the window using normal caged IP3. Representative examples of Ca2+ release evoked by pairing 1.5 s large UV flashes (dotted circle) and bAPs at 0.5 and 5 s delays from the end of the flash. The artifacts from the UV flashes were digitally subtracted (see Methods). (D) Peak amplitudes of Ca2+ release, normalized to amplitudes at 0 ms delay, as a function of the delay of the bAP from the end of the UV flash. White and black dots show data using large and small UV spots. Lines show linear fits to the normalized peak amplitudes. The times to half peak amplitude were more than 10 times longer than when normal caged IP3 was used.