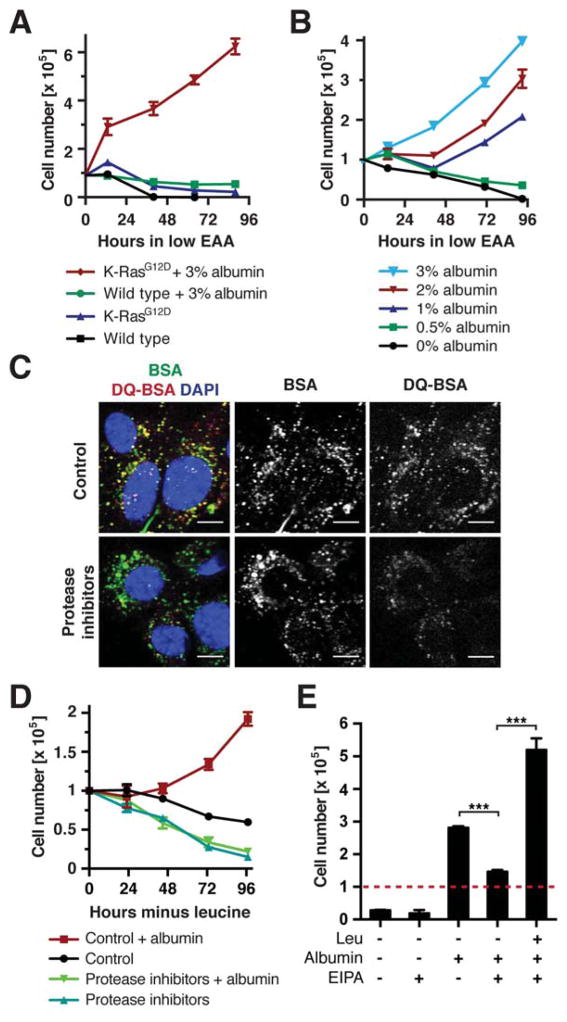
Figure 2. Macropinocytosis and Lysosomal Degradation of Extracellular Proteins Supports Growth of Ras Mutant Cells during EAA Starvation.
(A) Growth curve of wild type and K-RasG12D MEFs in amino acid-deficient medium containing EAAs at 5% of the levels in complete medium ± 3% albumin. (B) Growth curve of K-RasG12D MEFs in amino aciddeficient medium containing 5% EAAs supplemented with indicated albumin concentrations. (C) Uptake and intracellular degradation of albumin in K-RasG12D MEFs, assessed by fluorescently labeled BSA and DQ-BSA. Protease inhibitors: 2 μM pepstatin A, 2 μM E-64, 10 μM leupeptin. Scale bars = 10 μm. (D) Growth curve of K-RasG12D MEFs in leucine-free medium ± 3% albumin and protease inhibitors as in (C). (E) Cell numbers of K-RasG12D MEFs at day 3 of culture in leucine-free medium ± 3% albumin and 25 μM EIPA. The dashed line indicates starting cell numbers. *** p < 0.001.
Data are represented as mean ± STDEV (n = 3). See also Fig. S2.

