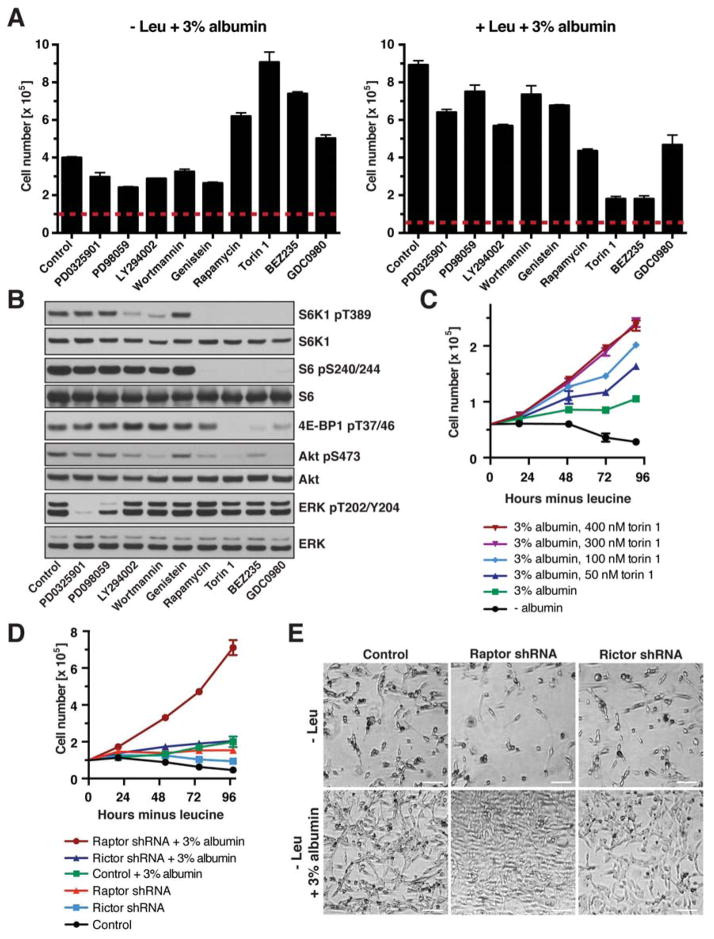
Figure 5. mTORC1 Signaling Is a Negative Regulator of Extracellular Protein-Dependent Growth.
(A) Cell numbers of K-RasG12D MEFs at day 3 of culture in leucine-containing or leucine-free medium + 3% albumin and following inhibitors: MEK1/2 (1 μM PD0325901, 50 μM PD98059), PI3-kinase (25 μM LY294002, 2 μM wortmannin), tyrosine kinases (50 μM genistein), mTOR (50 nM rapamycin, 250 nM torin 1), mTOR/PI3-kinase (0.5 μM BEZ235, 0.5 μM GDC0980). Dashed lines indicate starting cell numbers. (B) mTOR, PI3-kinase and MAP kinase pathway activity in K-RasG12D MEFs cultured for 1 day in leucine-free medium + 3% albumin, analyzed by WB. Inhibitors were as in (A) (C) Growth curve of K-RasG12D MEFs in leucine-free medium ± 3% albumin and indicated concentrations of torin 1. (D) Growth curve of K-RasG12D MEFs expressing shRNA against Raptor, Rictor or control in leucine-free medium ± 3% albumin. (E) Bright field images of K-RasG12D MEFs expressing shRNA against Raptor, Rictor or control at day 4 of culture in leucine-free medium ± 3% albumin. Scale bars = 50 μm.
Data are represented as mean ± STDEV (n = 3). See also Fig. S5.

