
Figure 1. Conventional cascade framework and its limitations.
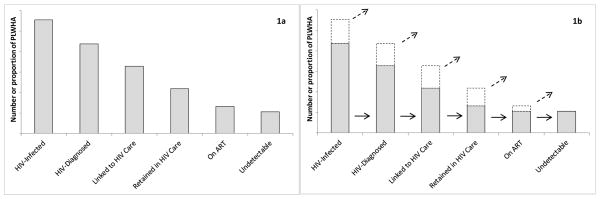
1a. The conventional cascade framework: a bar chart describing testing-, care-, and treatment-related attributes of the HIV-infected population, with sequentially smaller bars as the level of positive interaction with HIV testing and care services increases from left to right. 1b. Limitations of the conventional framework. It does not explicitly describe movement across cascade stages nor the disposition of those missing from subsequent bars; the implied interpretation is that a subset of people at each stage (lower gray segment of each bar) moves on to the next one (solid arrows), with the remaining subset (upper white segment with dashed border) exiting the cascade (dashed arrows) and acquiring an unknown disposition.