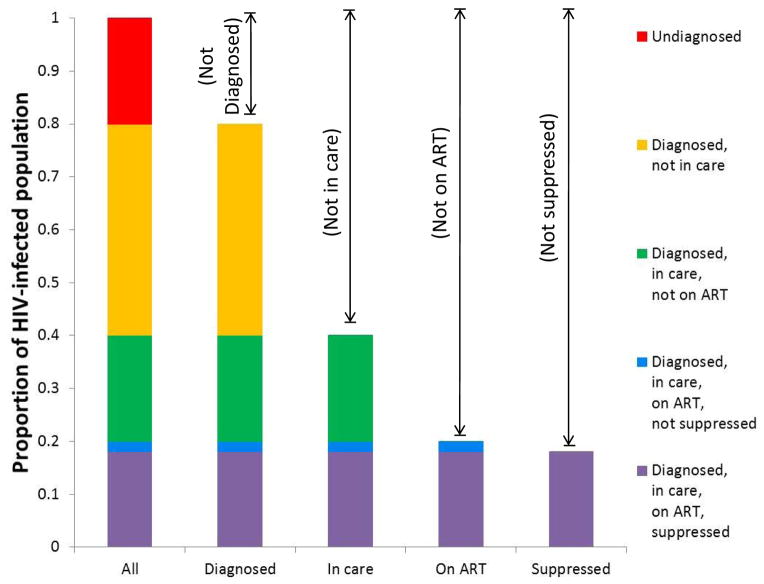
Figure 3. Translation of “HIV States and Transitions” framework into bar chart form: aggregation, overlaps, and complements.
The five proposed states (represented by the five different colors) and combinations thereof. The particular proportions shown are hypothetical and do not represent a specific population.

