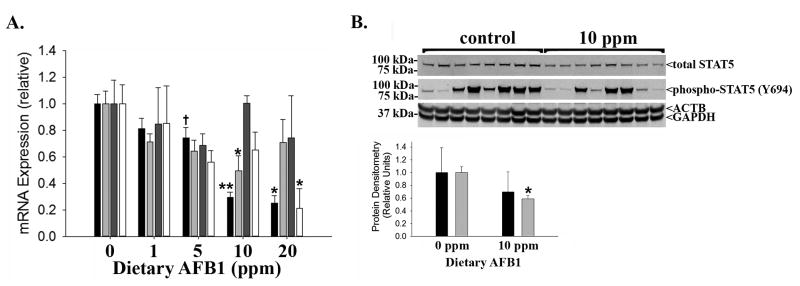
Figure 3. Effects of Dietary AFB1 on GH Signaling.

(A) Hepatic mRNA expression of Igf1 (black bars; *p<0.01 vs. 0, 1, 5 ppm; **p<0.02 vs. 0, 1, 5 ppm; †p=0.04 vs. 0 ppm), Ghr (light grey bars; *p=0.02 vs. 0 ppm), Stat5a (dark grey bars; no significant differences), and Stat5b (white bars; *p=0.03 vs. 0 ppm) in Fischer rats exposed to dietary AFB1. (B) Protein immunoblot (upper panel) and quantification (lower panel) of hepatic expression of phosphorylated (Y694) and total STAT5 (*p=0.001 vs. 0 ppm control; β-actin (ACTB) and GAPDH shown as loading controls; phospho:total STAT5, black bars; total STAT5:GAPDH, grey bars).
