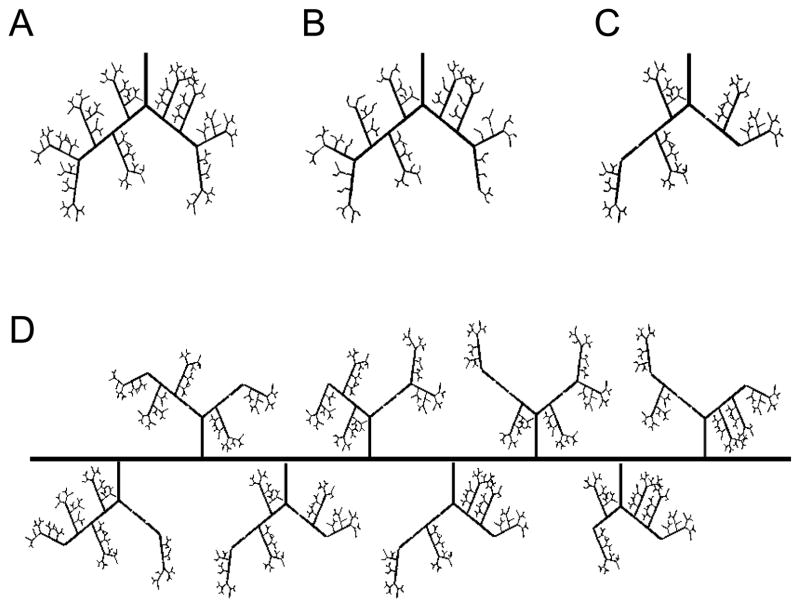
Figure 1. Schematic of arteriolar network generation.
Vessel rarefaction in individual arteriole trees with (A) 0%, (B) 44% rarefaction of 7A vessels, (C) and 44% rarefaction of 4A vessels. (D) In whole muscle perfusion simulations, individual arteriole trees with a given degree of random rarefaction (44% of 4A vessels here) were placed equidistant along a main feeder artery. Total conductance was calculated for each individual arteriole tree.

