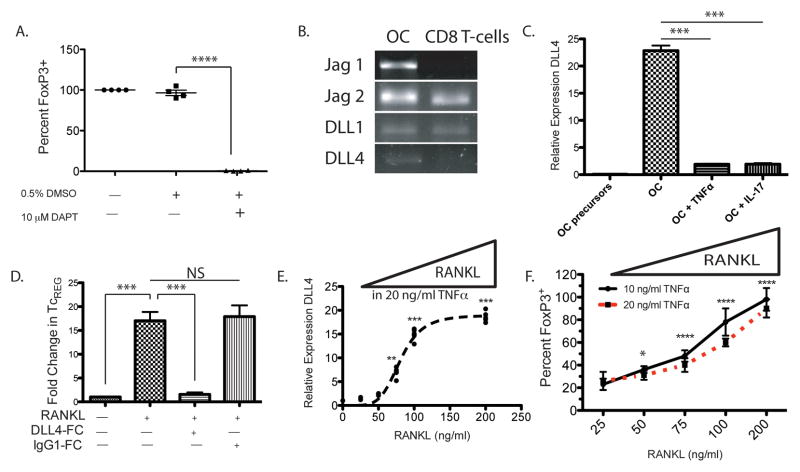
Figure 5. Notch signaling by ligand DLL4, expressed on osteoclasts, induces TcREG in vitro.
A. Inhibition of γ-secretase blocks TcREG induction by osteoclasts: DAPT, a γ-secretase inhibitor, dissolved in DMSO was used to test the role of Notch signaling in the induction of TcREG. 10 μM DAPT completely inhibited TcREG induction. Data represents four independent experiments with four wells/group/experiment. B. Notch ligands expressed in mature osteoclasts: RT-PCR was used to determine which Notch ligands are expressed on osteoclasts and CD8 T-cells. Of the six Notch ligands encoded in the mouse genome, mature osteoclasts express Jagged (Jag)-1, Jag-2, Delta-like (DLL)-1 and DLL4. The CD8 T-cells also express Jag2 and DLL-1. C. RANKL induces DLL4 expression while IL-17 and TNFα represses it: Of these four Notch ligands expressed in mature osteoclasts, only DLL4 was absent in the osteoclast precursors by qPCR. DLL4 expression was repressed in mature osteoclasts in the presence of recombinant murine 20 ng/ml TNFα and 10 ng/ml IL-17A. D. Blockade of DLL4 inhibits TcREG induction in vivo: Soluble DLL4-Fc, but not a control IgG1-Fc, administered 2 hours prior to RANKL administration blocked TcREG induction in vivo. The design of this in vivo induction experiment was identical to that used in Fig. 1B and 1C. E. DLL4 acts as switch in response to RANKL levels: Addition of RANKL increased the expression of DLL4 even in the presence of 20 ng/ml TNFα. F. RANKL addition in presence of TNFα restores TcREG induction by osteoclasts: Concomitant with the expression of DLL4, addition of RANKL also restores induction of TcREG in the presence of 10 (solid line) or 20 ng/ml (dashed line) TNFα. Statistical comparisons (P values) are relative to 25 ng/ml RANKL and 20 ng/ml TNFα treatment. ANOVA indicates that 90.7% of the variance was accounted for by RANKL treatment (P < 0.0001), and 1.83% of the variance by TNFα treatment (P = 0.0002). The interaction term accounted for 1.6% of the variance (P = 0.0147) indicating that the effect of RANKL was dominant at both concentrations of TNFα tested. The results represent mean ± standard deviation (error bars) from three independent experiments with 4 wells/group/experiment. P values were calculated using Mann-Whitney test; **** = P < 1×10⁴; *** = P < 0.001; ** P < 0.01 and NS = not statistically significant.

