Figure 6.
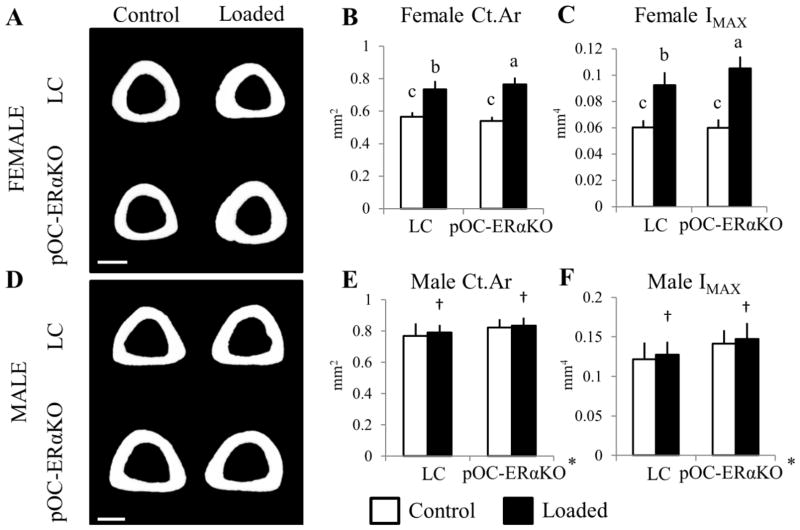
Tibial midshaft cortical bone mass was similar between pOC-ERαKO and LC mice, but knockouts responded more to 2 weeks of tibial compression; male pOC-ERαKO had increased cortical bone mass but responded similarly to loading as LC mice. Representative transverse 3D microCT reconstructions (45um thick) of the tibial midshaft in (A) female and (D) male 12-week-old LC (top) and pOC-ERaKO mice (bottom) after 2 weeks of left tibial loading. (B,C) Although Ct.Ar was not different between LC and pOC-ERaKO female mice in the right, control limb, after 2 weeks of tibial loading, Ct.Ar increased more in pOC-ERaKO mice (+41%) vs. LC (+28%), as did IMAX. (E,F) Male pOC-ERaKO mice had increased Ct.Ar and IMAX at the tibial midshaft in the right unloaded limbs, and both genotypes showed a similar increase in Ct.Ar and IMAX after 2 weeks of mechanical loading.
Ct.Ar, cortical area; IMAX, maximum moment of inertia. Data are mean ± SD, n=12–14 per group. *pOC-ERαKO different from LC, †Loaded tibia different from Control, p<0.05 by repeated measures ANOVA with interaction for each sex. Bars not sharing same letter are significantly different from one another from Tukey HSD post-hoc only when interaction term (load*genotype) was significant. Scale bar = 0.5mm.

