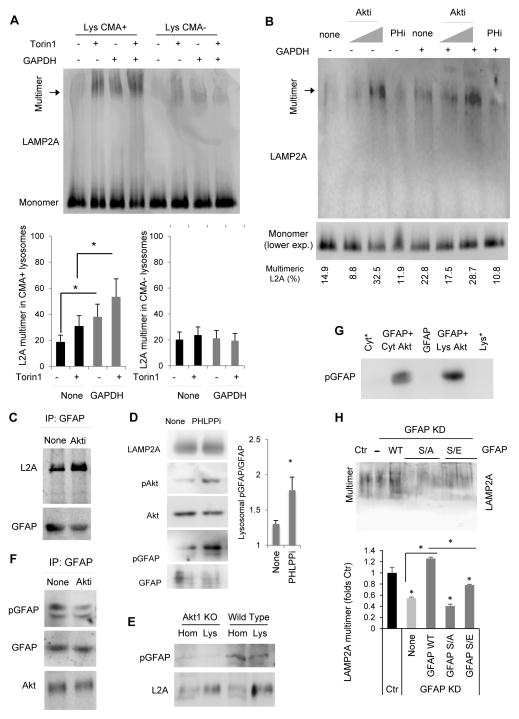
Fig. 7. The mTORC2/PHLPP1/Akt lysosomal axis regulates the dynamics of the CMA translocation complex.
A. Blue-native electrophoresis (BNE) and immunoblot for LAMP-2A of rat liver lysosomes with high (+) or low (−) CMA activity incubated with Torin1 and/or GAPDH as labeled. Bottom: Percentage of lysosomal LAMP-2A present in the 700kDa multimeric complex, n=3. B. Lysosomes incubated with Akt or PHLPP1 inhibitors and GAPDH processed as in A. C. Co-immunoprecipitation of LAMP-2A with GFAP from rat liver lysosomes untreated (None) or treated with Akt inhibitors. D. Immunoblot of starved rat liver lysosomes incubated with PHLPP1 inhibitor. Right: Ratio of pGFAP/GFAP at the lysosomal membrane. n=6. E. Immunoblot for pGFAP in homogenates (Hom) and lysosome-enriched fractions (Lys) isolated from MEFs from wild type (WT) and Akt1 knock-out (KO) mice. F. Immunoblot for the indicated proteins in immunoprecipitates of GFAP from lysosomes incubated as in C. G. Immunoblot for pGFAP of purified GFAP incubated with Akt affinity purified from rat liver cytosol (Cyt) or lysosomes (Lys) using an antibody against pAkt (Ser473). Cytosol and lysosomes are run as negative control to indicate absence of pGFAP in these fractions. H. BNE and immunoblot for LAMP-2A of lysosomes isolated from cells control (Ctr) and knock-down for GFAP (KD) untransfected (−) or transfected with wild-type (WT) GFAP or GFAP in which the S in the consensus Akt phosphorylation motif has been mutated to A or E (3 clones for S/A, 2 clones for S/E are shown). Expression levels of each transfected protein are shown in Fig. S7E. Bottom: LAMP-2A present in the 700kDa multimeric complex. Values are expressed as folds levels in control cells attributed an arbitrary value of 1. All values are mean+s.e.m., and differences are significant for p<0.05. See also Figure S7.

