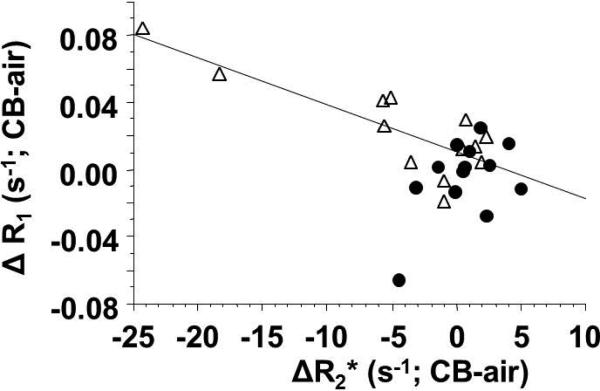
Figure 9. Correlation of quantitative TOLD and BOLD response to carbogen challenge.
Comparison of AT1 (●) and HI (△) tumors showed distinct trends for the group of 29 tumors. Mean change in R1 was closely reflective of R2* for HI tumors (linear fit shown, R2>0.67), but there was no obvious relationship for the AT1 tumors.

