
Figure 2.
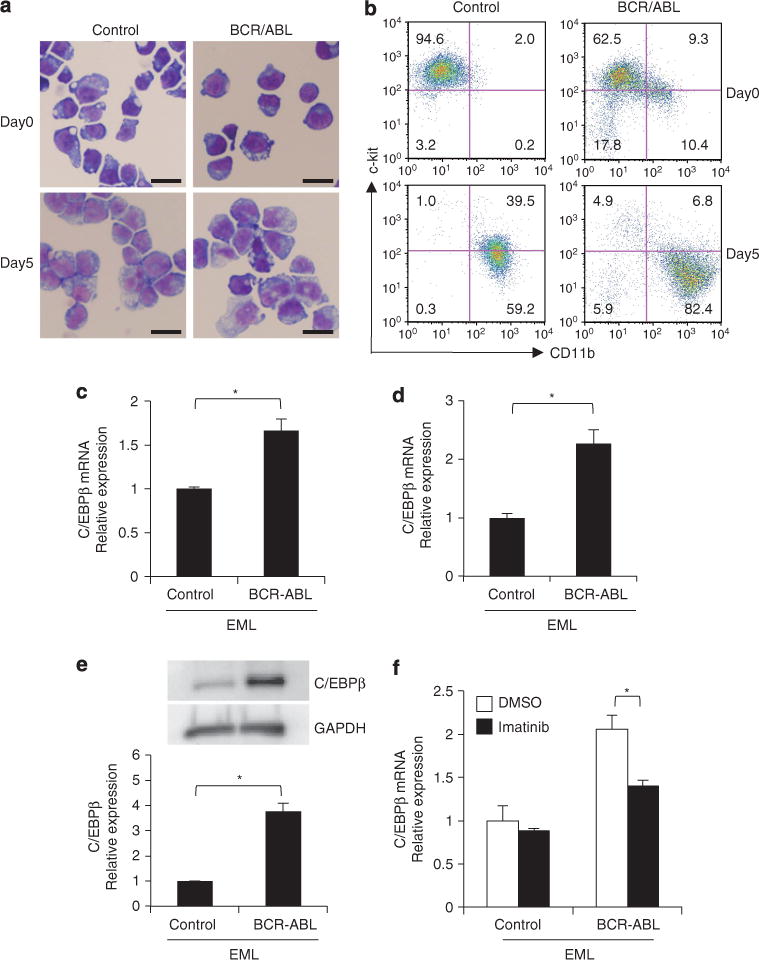
Effects of BCR–ABL on the expression of C/EBPβ in EML cells. (a) Wright Giemsa staining of pMSCVneo vector-transduced EML cells (EML-control) and BCR–ABL-containing pMSCVneo vector-transduced EML cells (EML-BCR–ABL) before (day 0) and after (day 5) the induction of myeloid differentiation (scale bar, 20 μm; original magnification, ×400). (b) Flow cytometric analysis of c-kit and CD11b expression in EML-control and EML-BCR–ABL cells (day 0 and day 5 after myeloid differentiation). Numbers in each quadrant indicate the percentage of live cells. (c) C/EBPβ mRNA levels in EML-control and EML-BCR–ABL cells. Results were normalized to the expression level of control. Error bars indicate s.d. from duplicate samples. Results are representative of three independent experiments. *P=0.011. (d) C/EBPβ mRNA levels in c-kit+ CD11b− fraction of the EML-control cells and EML-BCR–ABL cells. Results were normalized to the expression level of control. Error bars indicate s.d. from duplicate samples. *P<0.01. (e) C/EBPβ protein levels in EML-control and EML-BCR–ABL cells. Results were normalized to the expression level of control. Error bars indicate s.d. from duplicate samples. Results are representative of three independent experiments. *P<0.01. (f) C/EBPβ mRNA levels in EML-control and EML-BCR–ABL cells with or without a 48-h treatment with imatinib mesylate (100 nM). Dimethyl sulfoxide (DMSO) was used as the control. Results were normalized to the expression level of control. Error bars indicate s.d. from duplicate samples. Results are representative of three independent experiments. *P=0.016.