
Figure 3.
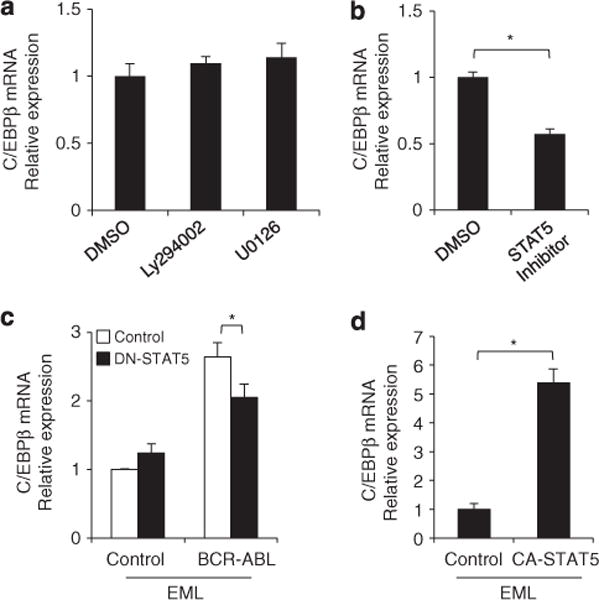
Involvement of BCR–ABL downstream signaling pathways in the upregulation of C/EBPβ. Changes in C/EBPβ mRNA in EML-BCR–ABL cells 24 h after treatment with the PI3K inhibitor Ly294002 (2.5 μM), the MEK inhibitor U0126 (25 μM) (a), or a STAT5 inhibitor (40 μM) (b). DMSO was used as the control. Results were normalized to the expression level of control. Error bars indicate s.d. from duplicate samples. Results are representative of two independent experiments. *P<0.01. (c) C/EBPβ mRNA in EML-control and EML-BCR–ABL cells transduced with a dominant-negative STAT5 mutant, STAT5Δ749. Results were normalized to the expression level of control. Error bars indicate s.d. from duplicate samples. Results are representative of two independent experiments. *P<0.05. (d) C/EBPβ mRNA levels in EML cells transduced with a constitutively active STAT5 mutant (CA-STAT5: STAT51*6) or empty-vector. Results were normalized to the expression level of control. Error bars indicate the s.d. from duplicate samples. Results are representative of two independent experiments. *P<0.01.