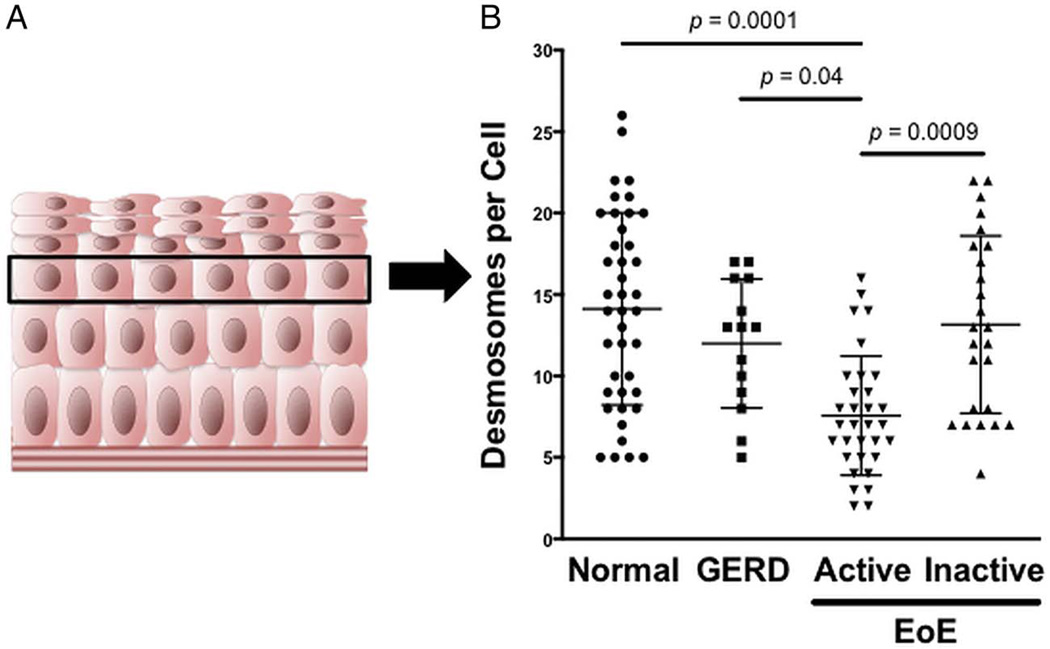
Figure 2.
Desmosome quantification. (A) Illustration of the oesophageal epithelium depicting the basal epithelial layer near the bottom and squamous epithelial layer near the top. The black box highlights the third prickle cell layer used to quantify desmosomes. (B) Number of desmosomes per cell in normal patients compared with those with GERD, active eosinophilic oesophagitis (EoE) and inactive EoE. Results are expressed as mean±SD.

