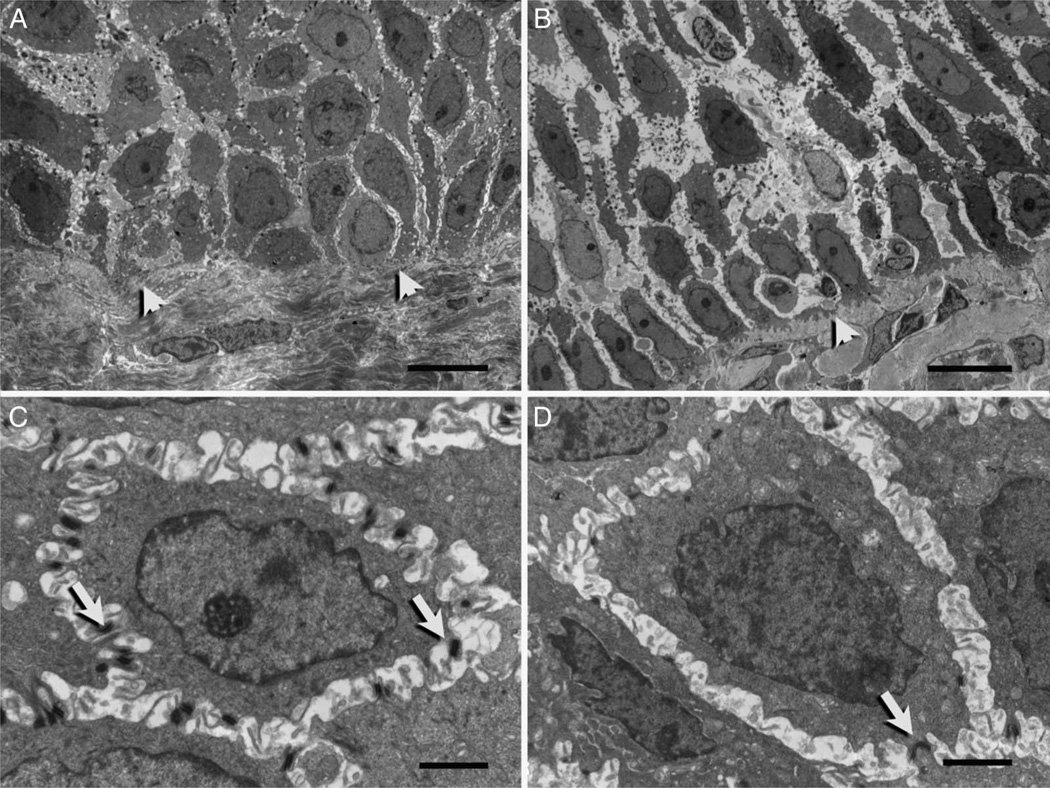
Figure 3.
Electron micrographs of basal epithelial cells from normal patients (A–C) and patients with active eosinophilic oesophagitis (B and D). A and B illustrate relative intercellular spaces. Arrowheads indicate the basal lamina separating basal cells from the lamina propria. (C and D) depict desmosomes (arrow) encircling basal cells located within the third prickle cell layer. Scale bars represent 10 µ (A and B) and 2 µ (C and D).

