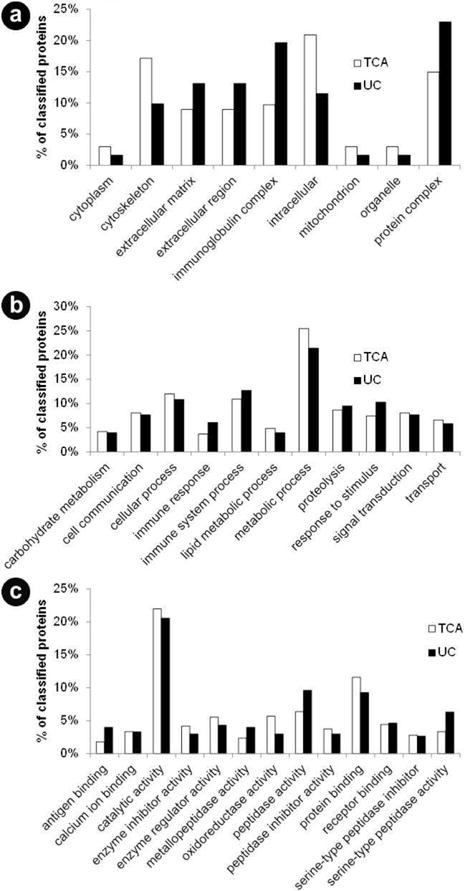
Figure 4.

Gene ontology analysis. Using the Panther classification system, gene ontology analysis revealed differences in the cellular compartments (a.), biological processes (b.), and molecular functions of proteins identified in trichloroacetic acid-precipitated (TCA) samples compared to proteins in the ultracentrifugation-precipitated samples (UC) (c.). Note that the data is normalized for each sample as 440 proteins were considered for TCA and 196 for UC.
