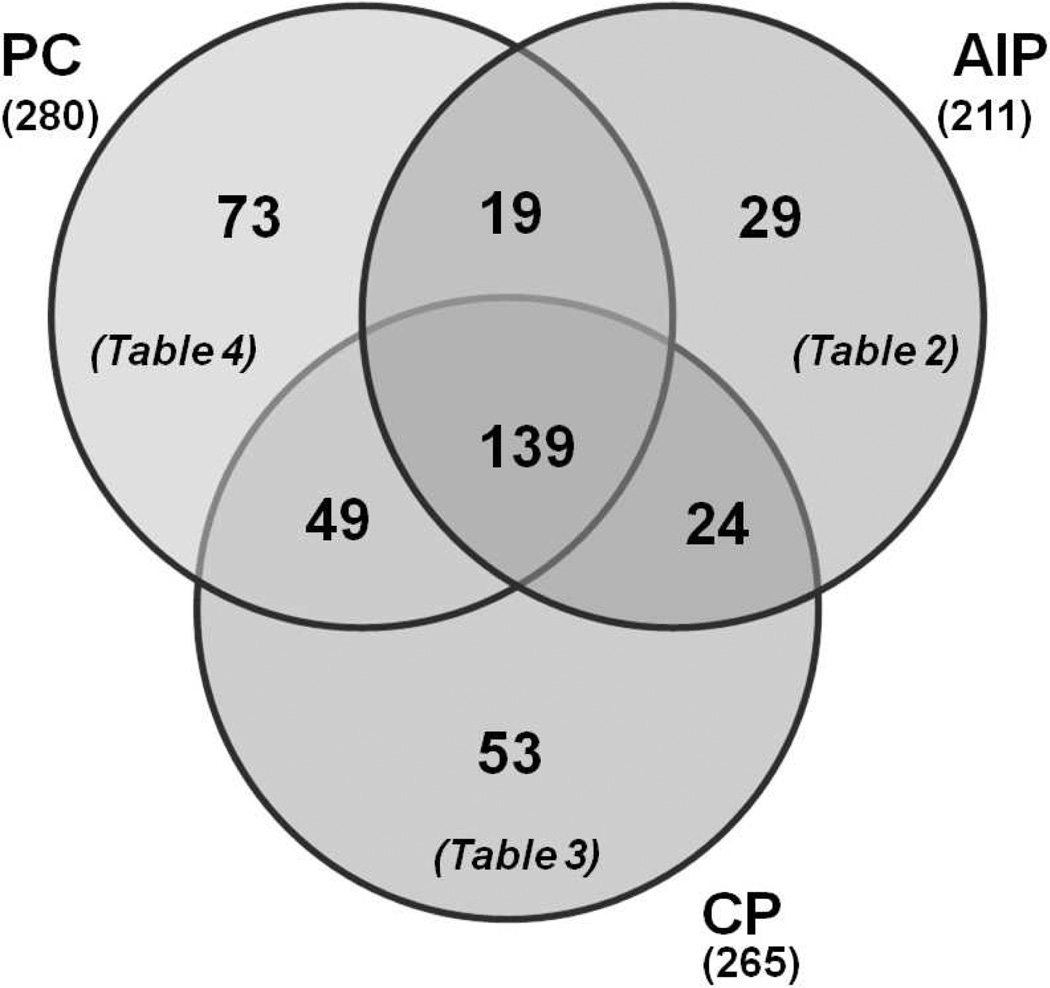
Figure 2.
Distribution of proteins among the three cohorts. Venn diagrams showing unique and overlapping proteins among the three cohorts. Also indicated in the figure are references to the tables in which these sets of proteins are listed.
AIP: autoimmune pancreatitis; CP: chronic pancreatitis; PC: pancreatic cancer

