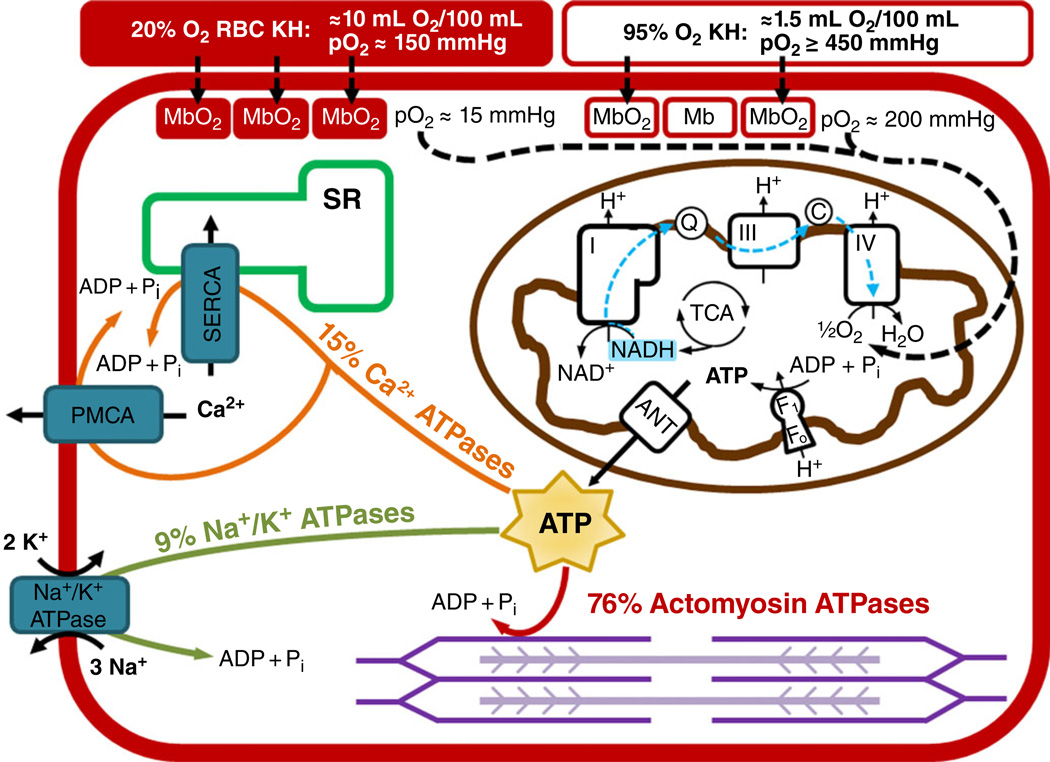
Figure 1. Conceptual representation of oxygen delivery, ATP production and ATP utilization in a cardiac myocyte.
Oxygen is carried to myocytes via Krebs-Henseleit (KH) solution with red blood cells (RBCs) bubbled with 20% O2-5% CO2-75% N2 (red filled rectangle) has a PO2 of ~150 mmHg, an oxygen-carrying capacity of 10 ml O2 (100 ml)−1, and results in a myoglobin oxygen saturation of ~90%. Krebs-Henseleit solution without RBCs bubbled with 95% O2-5% CO2 (red open rectangle) has a PO2 of ≥450 mmHg, an oxygen-carrying capacity of 1.5 ml O2 (100 ml)−1, and results in a myoglobin oxygen saturation of ~70%. In the mitochondria, electrons are harvested in the tricarboxylic acid (TCA) cycle and primarily reduce NAD+ to NADH. The NADH donates its electrons to Complex I of the electron transport chain, and these electrons travel to Complex IV, where oxygen is reduced to water. The proton motive force created during electron transport is used by the F1Fo ATP synthase to produce ATP. The ATP is transported out of the mitochondria via the adenine nucleotide translocase (ANT). The ATP is then primarily used for actin-myosin cross-bridge cycling (76%), calcium transport by the sarco/endoplasmic reticulum Ca2+-ATPase (SERCA) and the plasma membrane Ca2+-ATPase (PMCA; 15%), and the maintenance of membrane potential by the Na+,K+-ATPase (9%).

