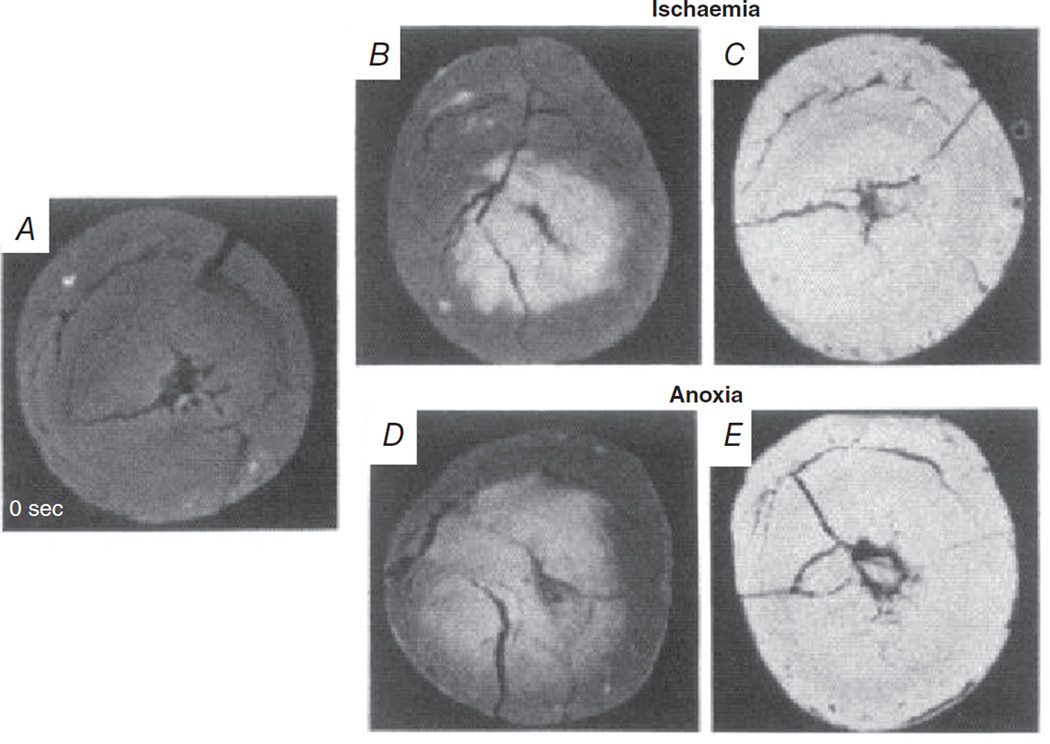
Figure 3. The transmural anoxic and ischaemic wave fronts initiate at the endocardium and progress to the epicardium as monitored by NADH fluorescence.
Freeze-dried cross-sections were taken at baseline (A), 10 s after onset of global ischaemia (B) or perfusion with anoxia media (D), and 60 s after the onset of ischaemia (C) or anoxia (E). Data from Kanaide et al. (1987), reproduced with permission.

