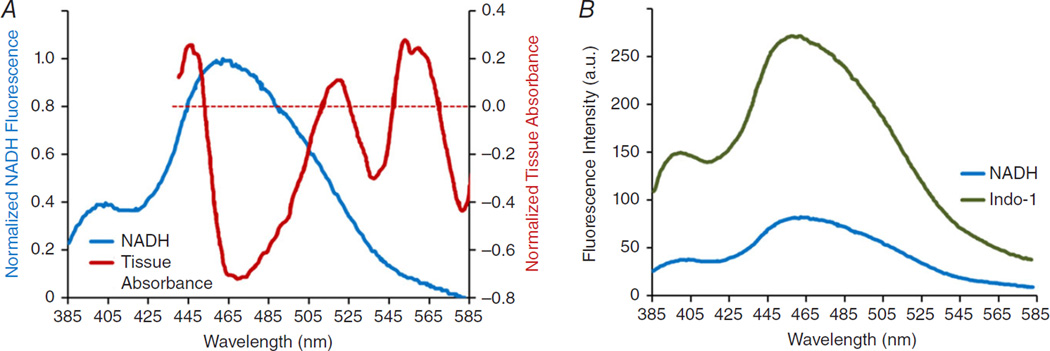
Figure 4. Spectral overlap of myocardial absorbance, NADH fluorescence and indo-1 AM fluorescence.
A, an overlay of tissue absorbance and NADH fluorescence spectra reveals potential cross-talk in the 445–505 nm range. Tissue absorbance spectra demonstrate the change in ventricular tissue absorbance from hypoxia (0) to normoxia. Myocardial absorbance within 445–505 nm is dominated by myoglobin and decreases during hypoxia, while NADH fluorescence increases within the same wavelength band. Spectra were each normalized to 1 and plotted together. B, an overlay of the emission spectra of indo-1 AM and NADH reveals potential cross-talk within wavelengths <565 nm. Data from Heineman et al. (1992) and Fralix et al. (1990), reproduced with permission.

