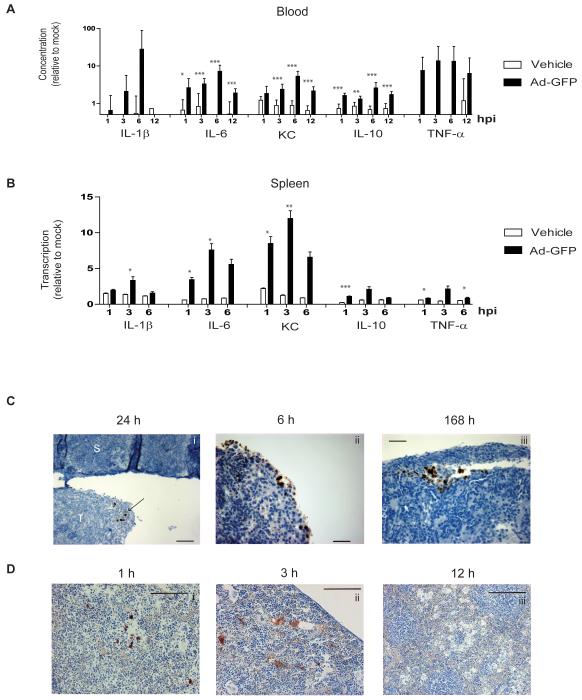
Fig.3. Adenovirus-induced cytokine production correlates with viral presence.
Female CD1nu/nu mice with intraperitoneal SKOV3ip1 tumours were injected IP with the non-replicating virus, Ad-GFP (1010 particles), or with vehicle. (n=3-5). hpi=hours post-infection.
A Cytokine protein in murine serum relative to 0 hours. Ad-GFP and vehicle are compared. Samples were analysed in triplicate and mean±SD is shown (*p<0.05, **p<0.01, ***p<0.001). KC=keratinocyte chemoattractant.
B. qRT-PCR analysis of spleen. Expression at 1, 3, and 6 hours is shown relative to 0 hours. Ad-GFP and vehicle are compared. Samples were analysed in triplicate and mean±SD is shown (*p<0.05, **p<0.01, ***p<0.001). KC=keratinocyte chemoattractant.
C+D. Female CD1nu/nu mice with intraperitoneal SKOV3ip1 tumours were injected IP with dl922-947 (1010 particles). Representative images are shown following immunohistochemistry for adenoviral E1A in IP tumours (C: T=tumour, S=spleen. Scale=50μm.) and Hexon protein in murine spleen (D: Scale=50μm (i and ii) or 100μm (iii).

