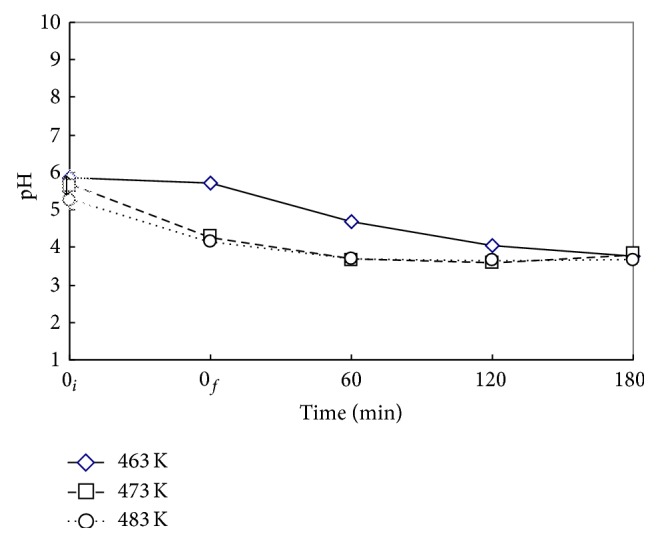
Figure 6.

Time variation of pH value for the decomposition of DMP via WOP at various T. ⋄, □, and ○: T = 463, 473, and 483 K. C 0 = 100 mg L−1, V L = 400 mL, P T = 2.41 MPa, and Nr = 500 rpm. Working gas after time = 0f is O2. ↕: Mean and Standard deviation (SD, n − 1 method) at t = 0i: 5.6 ± 0.3.
