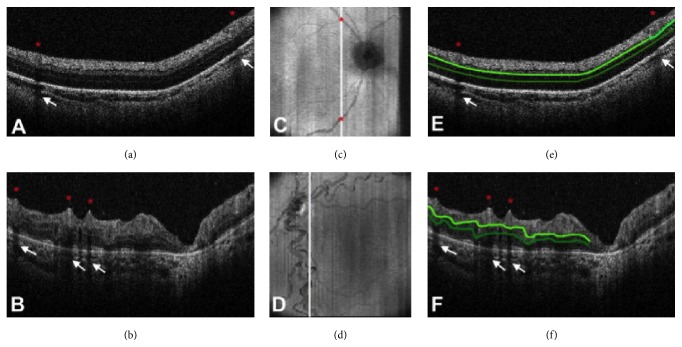
Figure 5.
The spectral domain optical coherence tomography (SD-OCT) scans from a 31-week postmenstrual age (PMA) neonate (a) with retinopathy of prematurity (ROP) zone II, stage 2, and normal vasculature per clinical examination and a 48-week PMA neonate (b) with ROP zone II, stage 3, and plus disease. No vessel elevation is seen in (a) and severe vessel elevation is seen in (b). Retinal images (c, d) created from axial compression of SD-OCT scans. (e) and (f) contain the same scans as (a) and (b), respectively, but highlight the smooth retinal layer contour in (e) and the scalloped pattern on (f). Red asterisks are placed over vessels, and the corresponding location on the retinal image is shown on (c) and (d). White arrows point to shadow produced by the corresponding vessels. ((e) and (f)) The top light green line represents the inner plexiform layer, and the bottom dark green line represents the outer plexiform layer. (Photo courtesy Figure 2, Page 129, of [32].)

