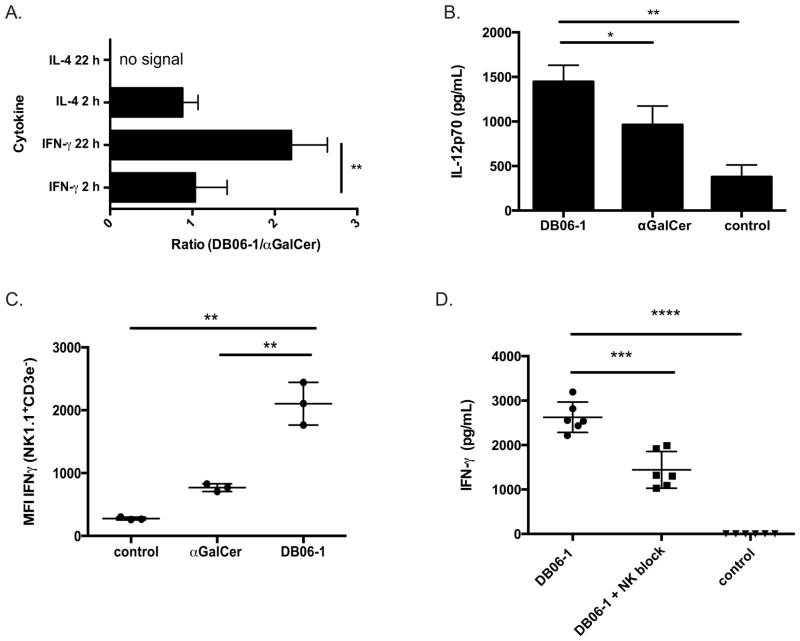
FIGURE 3. Th1 cytokine skewing depends on IL-12 and NK cells.
(A) Ratio (DB06-1/αGalCer) of 2 and 22 h cytokine concentrations in sera obtained from C57BL/6 mice after i.v. injection of 1 μg lipid either DB06-1 or αGalCer as measured by ELISA. Data are combination of four independent experiments. Error bars represent ± SEM. (B) IL-12p70 measured by ELISA in sera from C57BL/6 mice injected i.v. with 1 μg of αGalCer or DB06-1 compared to uninjected control mice at 6 h post injection. Data are representative of mouse triplicates for each group for one of two independent experiments. Error bars represent ± SEM. (C) NK cell IFN-γ production from C57BL/6 mice injected iv with 1 μg DB06-1. Splenocytes from DB06-1 or αGalCer injected mice and controls were isolated and cultured in complete media containing GolgiPlug (BD Biosciences) for 4 h. NK cells were gated as live, B220− NK1.1+ CD3ε− cells. The total ICCS IFN-γ MFI of NK cells is plotted. Data are representative of mouse triplicates for each group from one of three independent experiments. Error bars represent ± SEM. (D) IFN-γ in the sera as measured by ELISA at 24 h post injection of DB06-1 of C57BL/6 mice depleted of NK cells with Anti-Asialo-GM1Ab (NK block) were compared to controls. Data are representative of mouse triplicates for each group for one of two independent experiments. Error bars represent ± SEM.

