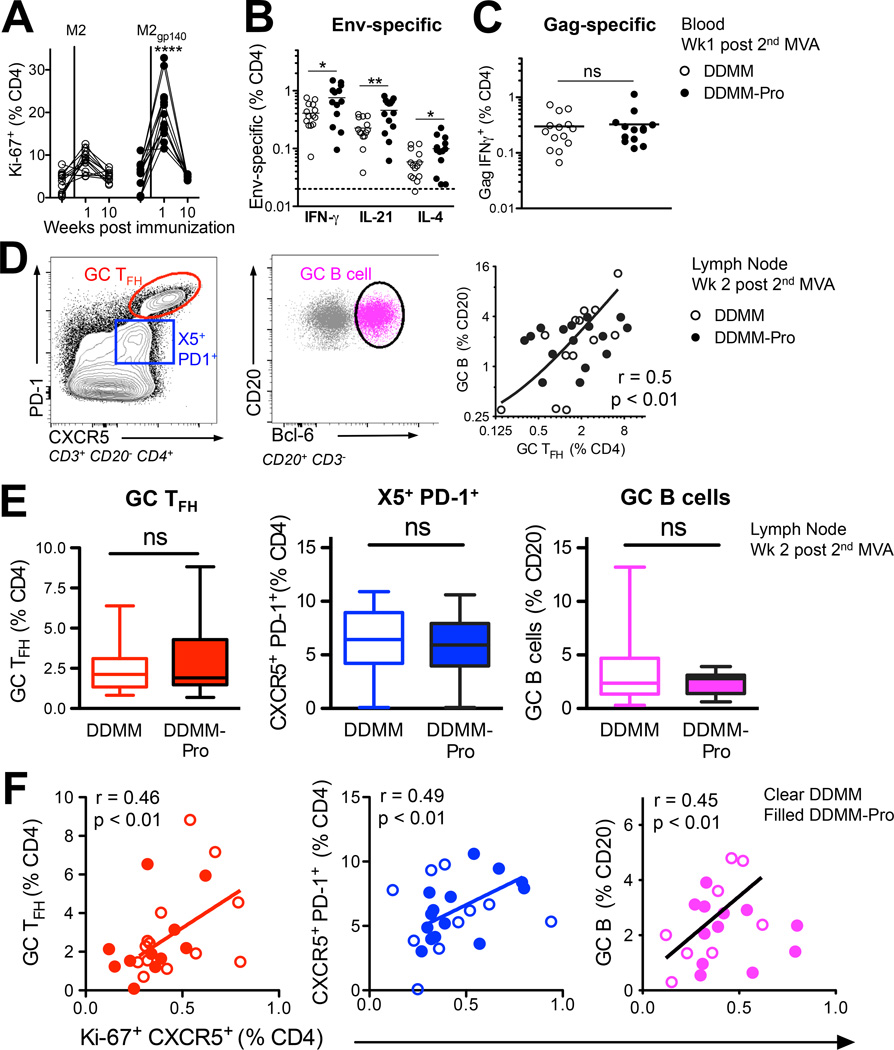
Figure 3. Blood CXCR5+ CD4+ T cells predict germinal center TFH cell and B cell responses.
(A) Higher frequency of Ki-67+ CD4+ T cells after 2nd MVA in DDMM-Pro group (****, p < 0.0001 at week 1 with a two-tailed, non-parametric t test). (B) To determine if gp140 boost resulted in higher Env-specific CD4+ T cells, responses were compared using a one-tailed t test, which showed increased Env IFN-γ+, IL-21+, and IL-4+ frequencies in DDMMgp140 group at week 1 post 2nd MVA immunization and no change in (C) Gag responses. (D) Inguinal lymph nodes were biopsied from the lymph node non-draining to immunization site at 2 weeks post-2nd MVA immunization (E) Flow plot shows presence of distinct subsets of CXCR5+ CD4+ T cells in lymph node ; PD-1++GC TFH (red) , PD-1+, (blue) , and PD-1 cells. Middle panel shows GC B cells identified by Bcl-6 and scatter lot shows correlation between GC B cells and GC TFH cells. (D) Inclusion of gp140 boost did not alter frequencies of GC TFH cells, CXCR5+PD-1+, and GC B cells. (F) To determine if responses in blood (at week 1 post 2nd MVA) were positively correlated with magnitude of GC responses, these indices were correlated using a one-tailed Spearman correlation (*, p < 0.05). Blood Ki-67+ CXCR5+ cells correlated with GC TFH cells (R2 = 0.21), CXCR5+ PD-1+ TFH cells (R2 = 0.24), and GC B cells (R2 = 0.20) in lymph node.

