Figure 1.
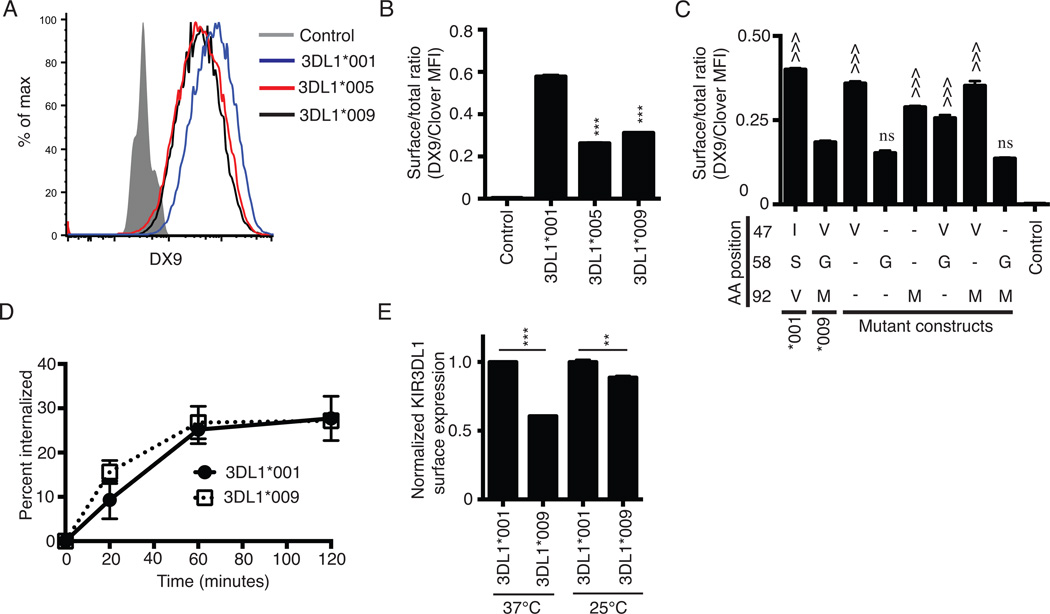
KIR3DL1*009 is expressed at a low surface density. A, Flow cytometry histogram of KIR3DL1 surface expression on HEK293T cells following transfection with the C-terminally Clover tagged constructs encoding the alleles, KIR3DL1*001 (blue), KIR3DL1*005 (red), or KIR3DL1*009 (black). Surface expression was detected on Clover positive cells using the KIR3DL1 specific antibody, DX9. HEK293T cells transfected with the construct encoding KIR3DL1*001 and stained with an isotype control antibody were used as the negative control (filled grey histogram). B, KIR3DL1 surface expression from panel A presented as a ratio of surface expressed KIR (DX9 MFI) to total KIR expression (Clover MFI). C, KIR3DL1 cell surface expression ratios following transfection of HEK293T cells with wild-type KIR3DL1*001, KIR3DL1*009, or mutant constructs of KIR3DL1*001. As in panel B, the data are presented as a ratio of surface expression (DX9 MFI) to total expression (Clover MFI). Dashes represent amino acids that are the same as KIR3DL1*001 at the respective position. D, Internalization of KIR3DL1*001 (closed circle) and KIR3DL1*009 (open square) was monitored on transfected HEK293T cells following incubation at 37°C with PE-conjugated DX9 for indicated time points. E, KIR3DL1 surface expression on HEK293T cells transfected with KIR3DL1*001 (dashed black line) or KIR3DL1*009 (solid black line) following culture at either 37°C or 25°C. Surface expression was detected on Clover positive cells using DX9. The KIR3DL1 surface expression ratios are normalized to the ratio obtained for KIR3DL1*001 at each temperature independently. All experiments were performed in triplicate and reproduced in three independent experiments. The data from panels B and C were analyzed by one-way ANOVA followed by a Tukey’s multiple comparisons test. The data for each temperature in panel E were analyzed independently using an unpaired Student’s t-test (vs. KIR3DL1*001, *** P<0.001; vs. KIR3DL1*009, ^^^ P<0.001; ns, not significant).

