Figure 3.
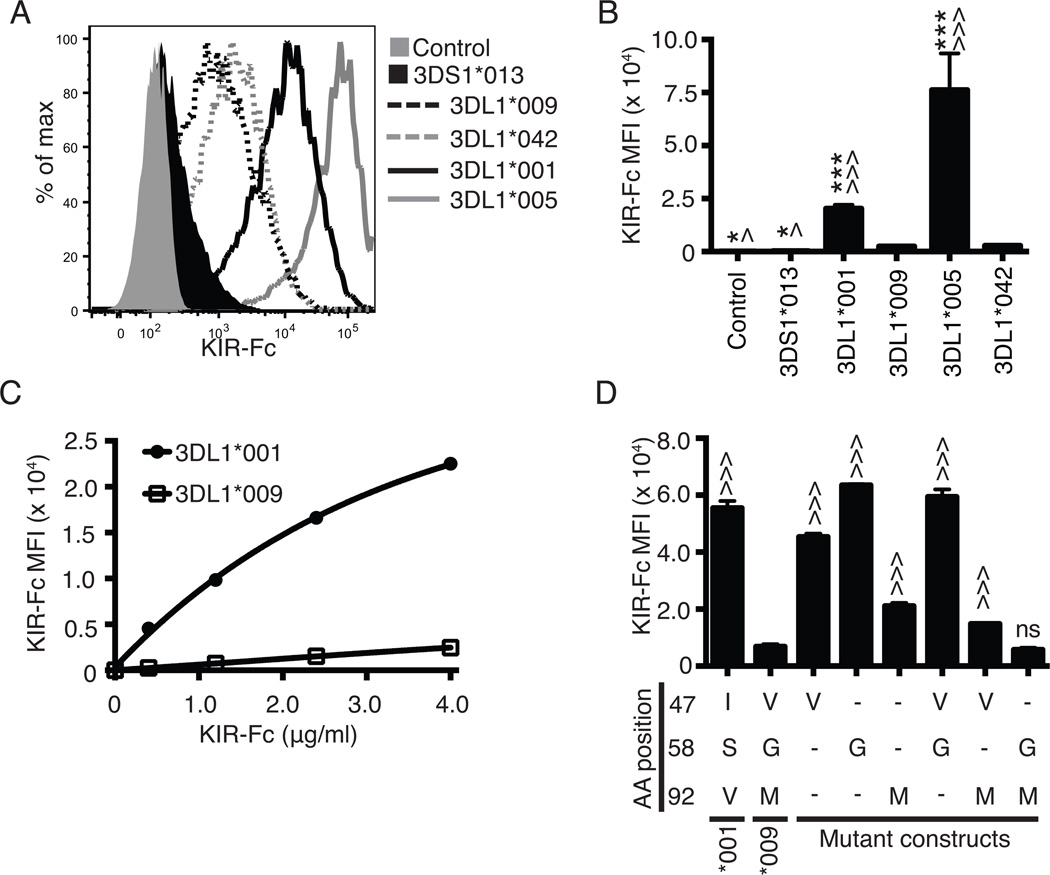
Combined polymorphisms at amino acid positions 58 and 92 disrupt binding capacity of KIR3DL1 to HLA-B*44:03. A, Flow cytometry was used to assess 4.0 µg/ml of KIR3DL1*001-Fc (solid black line), KIR3DL1*009-Fc (dashed black line), KIR3DL1*005 (solid grey line), KIR3DL1*042 (dashed grey) or KIR3DS1*013-Fc (filled black line) binding to HLA-B*44:03 on the surface of 721.221 cells. Probing of the HLA class I negative parental 721.221 cells with KIR3DL1*001-Fc was used as the negative control (filled grey histogram). The amount of KIR-Fc binding was detected via flow cytometry using a PE-conjugated antibody specific for human IgG (KIR-Fc MFI). B, The MFI values obtained for the amount of PE secondary antibody binding (KIR-Fc MFI) represent the quantity of KIR-Fc protein binding from panel A. C, MFI values following flow cytometry analysis of binding of KIR3DL1*001-Fc (closed circle) and KIR3DL1*009-Fc (open square) to HLA-B*44:03 on 721.221 cells are presented for a concentration gradient of soluble KIR-Fc concentrations (0.4 – 4.0 µg/ml). D, Displayed are the MFI values representing binding of each KIR-Fc protein (4.0 µg/ml) to HLA-B*44:03 on 721.221 cells as detected by a PE-conjugated secondary antibody. Dashes represent amino acids that are the same as KIR3DL1*001 at the respective position. All experiments were performed in triplicate and repeated in three independent experiments. The data were analyzed by one-way ANOVA followed by a Tukey’s multiple comparisons test (vs 3DL1*009-Fc, ^ P < 0.05, ^^^ P < 0.001; vs. KIR3DL1*042, * P < 0.05, *** P<0.001; ns, not significant).

