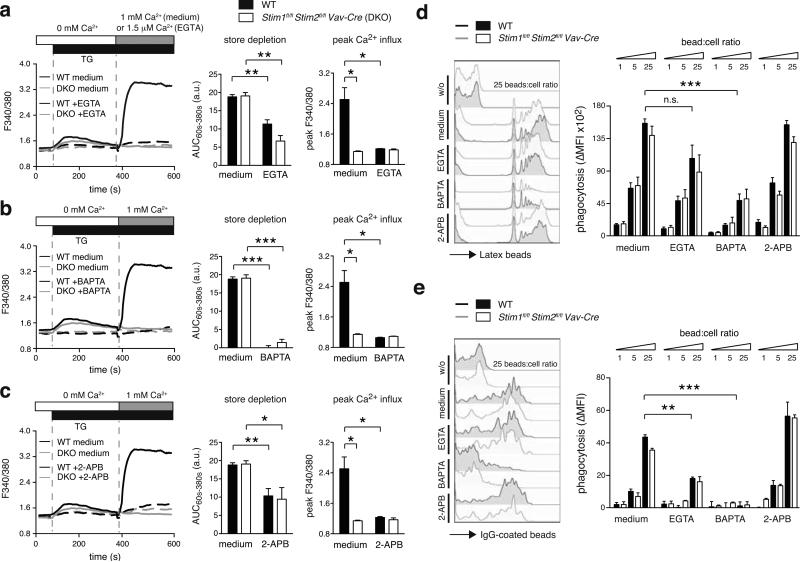
Figure 2. Phagocytosis by BMDMs requires intracellular Ca2+ signaling but not SOCE.
(a-c) WT and Stim1fl/flStim2fl/fl Vav-Cre BMDMs were left untreated (medium) or incubated with 2.2 mM EGTA (a), 10 μM BAPTA-AM (b), or 50 μM 2-APB (c) for 30 min and [Ca2+]i was analyzed using a FlexStation3 (ac, left panels). Store depletion (AUC60s-380s) and peak Ca2+ influx (peak F340/380) were quantified from 3 individual mice per group (a-c, right panels). (d,e) WT and Stim1fl/flStim2fl/fl Vav-Cre BMDMs were incubated with 1, 5, and 25 bead-to-cell ratios of carboxylate-modified yellow-green microspheres (d) or FITC-labeled IgG-coated fluorescent beads (e) for 2 h with medium alone or with 2.2 mM EGTA, 10 μM BAPTA-AM, or 50 μM 2-APB as described in (a-c). Phagocytosis was quantified by flow cytometry (left panels) and data from 3 mice per group was compiled as ΔMFI (right panel), where ΔMFI = MFIbeads - MFIno beads. Bar graphs represent the mean ± SEM. Statistical significance was calculated with an unpaired Student's t test: *, p<0.05; **, p<0.005; ***, p<0.001.

