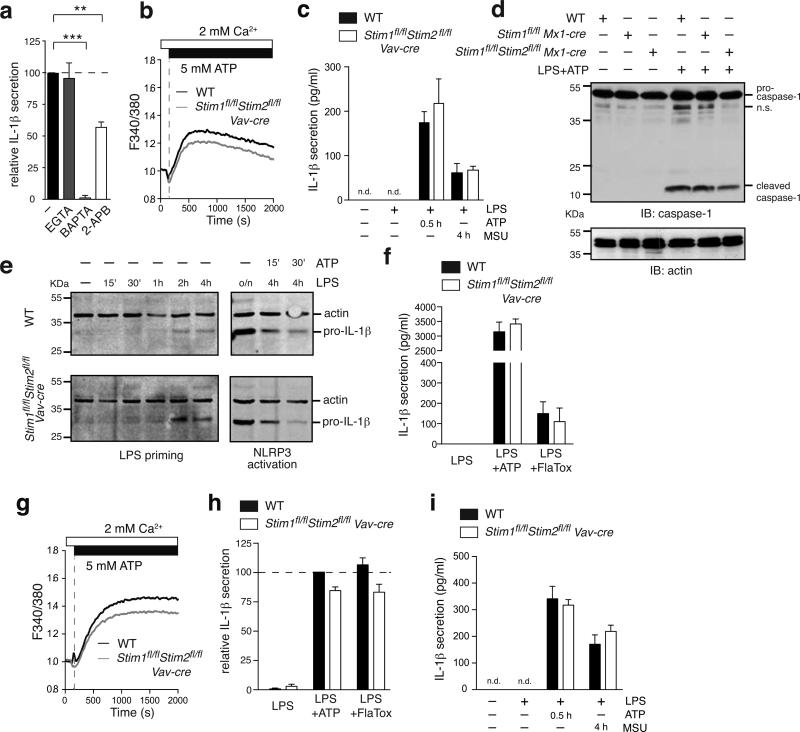
Figure 6. NLRP3 and NLRC4 inflammasome activation does not require STIM1 and STIM2.
(a) WT BMDMs were primed for 4 h with 10 μg/ml LPS with or without 2.2 mM EGTA, 10 μM BAPTA-AM or 50 μM 2-APB followed by addition of 3 mM ATP to activate the NLRP3 inflammasome. After 30 min, cell supernatants were analyzed for IL-1β by ELISA. Data are normalized to IL-1β levels in LPS+ATP activated WT BMDMs without inhibition. Bar graphs represent the mean ± SEM from 6 independent experiments. (b) Ca2+ signals in Fura-2 loaded BMDMs were measured after stimulation with 5 mM ATP in 2 mM Ca2+ Ringer solution using a FlexStation3 plate reader. One representative experiment of 2 is shown. (c) BMDMs were primed for 4 h with 10 μg/ml LPS followed by stimulation with either 3 mM ATP for 30 min or 150 μg/ml monosodium urate (MSU) crystals for 4 h to activate the NLRP3 inflammasome. Secreted IL-1β in the supernatant was analyzed by ELISA. Bar graphs represent the mean ± SEM of 4 experiments from 2 individual mice per group. n.d.: not detectable. (d) BMDMs were left untreated or stimulated with 10 μg/ml LPS for 4 hours followed by 3 mM ATP for 30 min to activate the NLRP3 inflammasome. Expression levels of pro-caspase-1 (~45 kDa), cleaved caspase-1 (~10 kDa) and actin (loading control) were analyzed by Western blotting. One representative experiment of 3 is shown. n.s., nonspecific. (e) BMDMs were primed with 10 μg/ml LPS for 15 min, 30 min, 1 h, 2 h, 4 h and 16 h (o/n) alone or followed after 4 h by stimulation with 3 mM ATP for 15 and 30 min to activate the NLRP3 inflammasome. Intracellular pro-IL-1β (~30 kDa) and actin levels were analyzed in whole cell extracts by Western blotting. (f) BMDMs were primed for 4 h with 10 μg/ml LPS followed by stimulation with 3 mM ATP for 30 min to activate the NLRP3 inflammasome or 10 μg/ml LFn-FlaA together with 5 μg/ml PA (referred as FlaTox) to activate the NLRC4 inflammasome. Secreted IL-1β in the supernatant was analyzed by ELISA. Bar graphs represent the mean ± SEM from 4 individual mice per group. (g-i) BMDC from WT and Stim1fl/flStim2fl/fl Vav-Cre mice were analyzed for Ca2+ influx (g) and activation of the NLRP3 (h, i) and NLRC4 (h) inflammasomes as described in panels b, c and f above. Ca2+ traces are representative of 2 repeat experiments; bar graphs show the mean ± SEM from 5 individual mice per group. Statistical significance was calculated with an unpaired Student's t test: **, p<0.005; ***, p<0.001.

