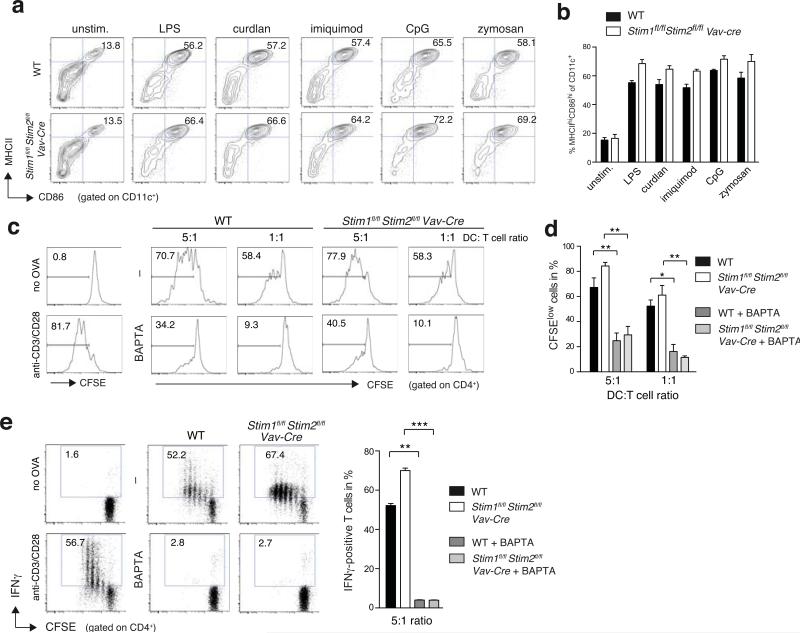
Figure 7. Antigen presentation by BMDCs and their ability to activate T cells is independent of STIM1 and STIM2.
(a,b) Maturation of BMDCs does not require SOCE. WT and Stim1fl/flStim2fl/fl Vav-Cre BMDCs were left untreated (unstim.) or stimulated with 1 μg/ml LPS, 50 μg/ml curdlan, 1 μg/ml imiquimod, 100 nM CpG, or 25 μg/ml zymosan for 16 h and expression of MHCII and CD86 on CD11c+ BMDCs was measured by flow cytometry. One representative experiment (a) and mean ± SEM of averaged frequencies of MHCIIhi CD86hi BMDCs from 5 individual experiments (b). (c-e) Antigen presentation and T cell activation by BMDCs. WT and Stim1fl/flStim2fl/fl Vav-Cre BMDCs were maturated with 0.1 μg/ml LPS and incubated with 500 μg/ml OVA protein with or without 10 μM BAPTA-AM for 30 min. After washing, OVA-loaded BMDCs were co-cultured at 5:1 and 1:1 ratios with CFSE-labeled WT OT-II CD4+ T cells for 3 d before CFSE-dilution of CD4+ T cells was analyzed by flow cytometry. CFSE-labeled OT-II T cells were incubated with BMDCs without OVA protein (no OVA) or anti-CD3 and anti-CD28 mAbs (anti-CD3/28) as negative and positive controls, respectively. (c,d) Representative histogram plots (c) of proliferated CFSElo OT-II cells at different DC:T cell ratios and quantification (mean ± SEM) of 3 experiments (d). (e) IFNγ production by OT-II cells was measured after co-culture of BMDCs and CFSE-labeled OT-II cells at a 5:1 ratio for 72 h followed by restimulation with PMA plus ionomycin for 6 h in the presence of Brefeldin A. IFNγ was measured by intracellular cytokine staining (left panel); the frequencies of IFNγ+ cells from 3 experiments are shown as mean ± SEM (right panel). OT-II T cells incubated with BMDCs without OVA protein (no OVA) or stimulated with anti-CD3 and anti-CD28 mAbs (anti-CD3/28) in the presence of 20 ng/ml rIL-12 were used as negative and positive controls, respectively. Statistical significance was calculated with an unpaired Student's t test: *, p<0.05; **, p<0.005; ***, p<0.001.

