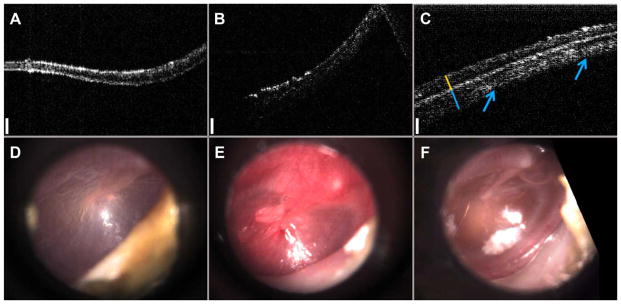
Fig. 2.

Representative depth-resolved cross-sectional OCT images: (A) normal, (B) acute OM, (C) chronic OM, and representative en face images from a commercial video otoscope: (D) normal, (E) acute OM, (F) chronic OM. Data from OCT images (A–C) enables quantitative distinction between infection types. Yellow and blue lines in (C) denote the location of the TM (yellow) and the biofilm (blue). Arrows highlight extent of biofilm across TM. Scale bars (white) represent 150 microns in depth. OCT images (A–C) are displayed on equal intensity scales to highlight the differences in optical scattering between each group. OCT =optical coherence tomography; OM =otitis media; TM =tympanic membrane.
