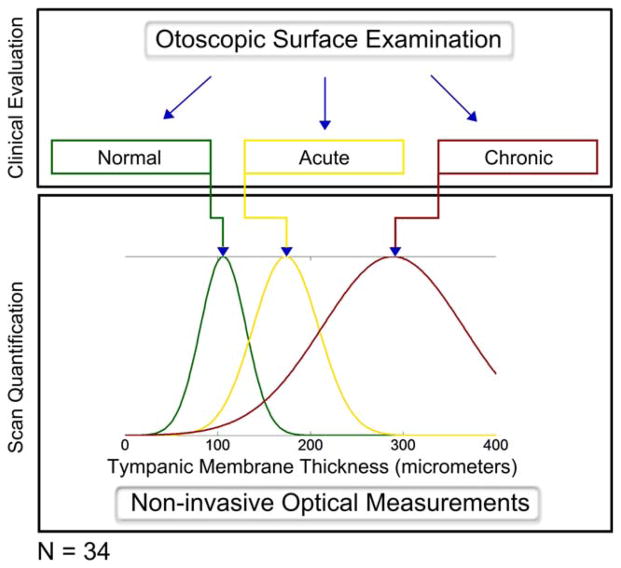
Fig. 3.
Study protocol schematic. The physician first performs the needed clinical examinations to form an unbiased diagnostic opinion of the participant. While standard otoscopy exams provide qualitative information to the physician, depth-resolved optical measurements quantify the status of the middle ear. OCT scans are then acquired and processed, quantitatively calculating a value for the thickness of the TM. The values reported for the mean and standard deviation of each subgroup, as shown in Figure 4, were used to create these normalized distributions. (Note: Chronic TM-only group not shown.) OCT =optical coherence tomography; TM =tympanic membrane. [Color figure can be viewed in the online issue, which is available at www.laryngoscope.com.]

