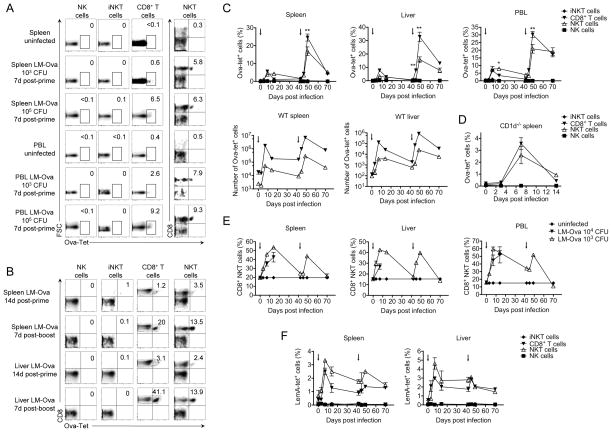
Figure 1. CD8+ NKT cells mount antigen-specific T cell response to Listeria infection with kinetics similar to that of conventional CD8+ T cells.
(A) Spleen and blood (PBL) of LM-Ova-infected mice (103 or 105 CFU) were analyzed on day 7 post-infection. Plots show the frequency of Ova-tetramer positive cells among gated NK, iNKT, and CD8+ T cells. For NKT cells, we show the distribution of Ova-tetramer versus CD8. (B–F) Mice were infected with 104 CFU of LM-Ova on day 0 and re-challenged with 2x10⁵ CFU on day 42, as indicated by arrows (C, E-F). (B) Plots show the distribution of CD8 versus Ova-tetramer staining among gated NK, iNKT, T, and NKT cell subsets. (C–D) Graphs show kinetics of frequency (C–D) and numbers (C) of Ova-tetramer positive cells among NK, iNKT, and CD8+ T cells from infected wild type (C) and CD1d−/− (D) mice. (E) Graphs show the frequency of CD8+ NKT cells in spleen, liver, and blood from mice infected with 104 or 105 CFU LM-Ova. (F) Graphs show kinetics of frequency of LemA-tetramer positive cells among NK, iNKT, and CD8+ T cells in spleen and liver. Data are representative of two independent experiments, n=4, mean ± s.e.m (D). Data are representative from one of three independent experiments, n = 3 for each (for days 0, 7, 49), data are representative from one of two independent experiments n = 3 for each (for days 3, 14, 42, 45, 70), mean ± s.e.m (C, E–F). *p < 0.05, **p < 0.01 between NKT and conventional CD8+ T cells.

