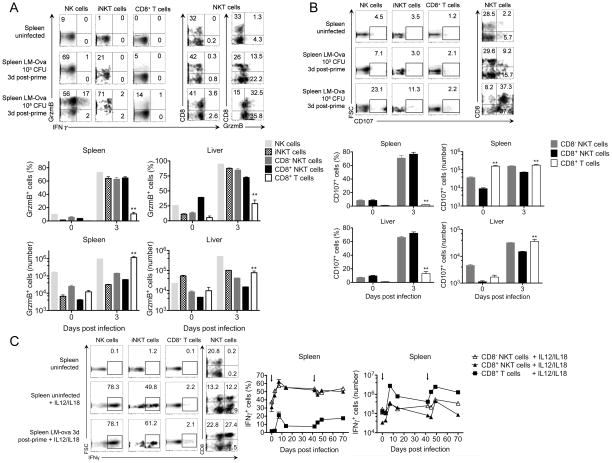
Figure 4. CD8+ NKT cells mount a robust innate immune response to Listeria infection.
C57BL/6 mice were infected with 103 or 105 CFU LM-Ova and analyzed 3 days post-infection in indicated organs. (A) Plots show the distribution of Granzyme B versus IFNγ expression among gated NK, iNKT, and CD8+ T cells. In NKT cells, we show the distribution of CD8 versus IFNγ and granzyme B expression. Graphs summarize the absolute number and frequency of granzyme B+ cell subsets. (B) Plots show the frequency of CD107 among gated NK, iNKT, and CD8+ T cells. In NKT cells, we show the distribution of CD8 versus CD107. Graphs summarize the absolute number and frequency of CD107 in CD8− NKT, CD8+ NKT, and CD8+ T cells. (C) Spleens from uninfected or day 3-infected mice were stimulated ex-vivo with IL-12 plus IL-18 for 4 hours. Plots show the frequency of IFNγ expression among gated NK, iNKT, and CD8+ T cells. In NKT cells, we show the distribution of CD8 versus IFNγ. Graphs show the kinetics of IFNγ expression among CD8− NKT, CD8+ NKT, and CD8+ T cells at frequency and absolute number levels. Data are representative from one of two independent experiments, n = 3 for each (A–C), mean ± s.e.m. *p < 0.05, **p < 0.01 between CD8+ NKT and conventional CD8+ T cells. For the kinetics of IFNγ expression, p < 0.01 for all time points tested between CD8+ NKT and conventional CD8+ T cells.

