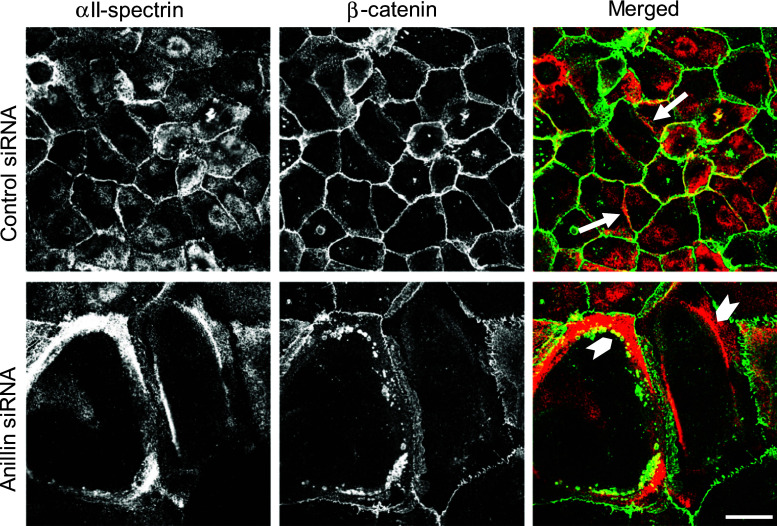
Fig. 7.
Anillin depletion affects cellular distribution of α-spectrin. DU145 cells were transfected with either control or anillin-specific siRNAs and subjected to dual immunolabeling for αII-spectrin (red) and β-catenin (green). Arrows indicate localization of αII-spectrin at intercellular junctions in control cells. Arrowheads highlight accumulation of cytoplasmic αII-spectrin aggregates in anillin-depleted cells. Scale bar 20 µm

