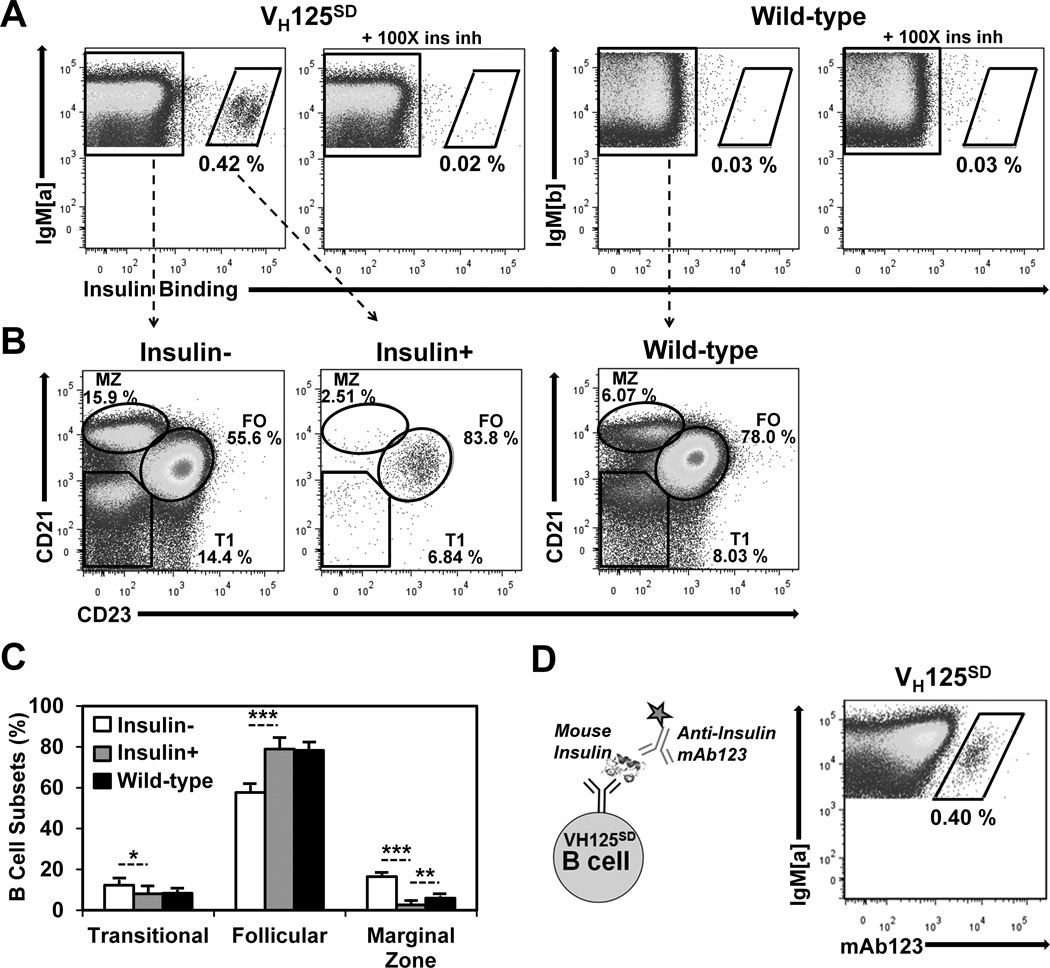
Figure 3. Anti-insulin B cells from VH125SD B6 mice undergo peripheral maturation.
(A) Splenocytes were gated on B220+ IgM+ live lymphocytes. Splenocytes were harvested from VH125SD (left) or WT (right) B6 mice and were incubated with 17 nM biotinylated human insulin with or without 100× free insulin to detect insulin-specific B cells using flow cytometry. Anti-IgMa detects transgenic B cells; anti-IgMb detects WT B cells (B) CD21 and CD23 expression were used to define Transitional 1 (T1), Follicular (FO), or Marginal Zone (MZ) B cell subset distribution of insulin (left), insulin+ (middle), or WT (right) B cells, quantified in (C) as subset percentage of IgM+ B cells. (D) Biotinylated anti-insulin mAb123, depicted in the schematic (left), was used to detect VH125SD B cells that bind endogenous rodent insulin (right). * p < 0.05, ** p < 0.01, *** p < 0.001, two-tailed t test.

