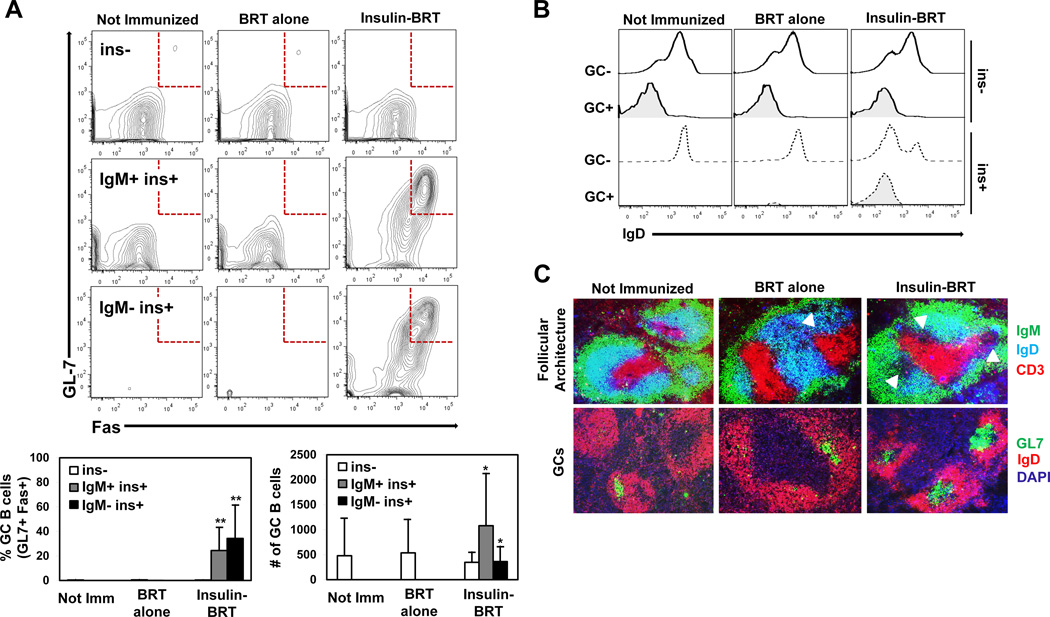
Figure 6. Insulin-specific germinal centers arise in VH125SD B6 mice.
VH125SD B6 mice were immunized with either BRT alone or insulin-BRT i.p. in 1X PBS. (A) Flow cytometry was used to assess GC B cell phenotype by GL7 and Fas expression on B cells (B220+ live lymphocytes) separated into non-insulin binders (ins, white), IgM+ insulin binders (IgM+ ins+, gray), and IgM insulin binders (IgM ins+, black). Representative plots (top) and GC B cell subset percent and cell number averages (bottom) are shown. (B) IgD expression was measured for ins (solid black line) and ins+ B cells (dashed line) following immunization, and representative histograms are shown. (C) Immunofluorescence microscopy detected follicular architecture (top, IgD CD3, GCs indicated by arrows) and GC structures (bottom, GL7+ IgD) in spleens from VH125SD B6 mice (n = 4). Follicles counted: n = 21 not immunized, n = 12 BRT alone, and n = 17 insulin-BRT. Data represent at least three independent experiments. Unless otherwise indicated, statistical comparisons are to unimmunized mice. * p < 0.05, ** p < 0.01, *** p < 0.001, two-tailed t test.

