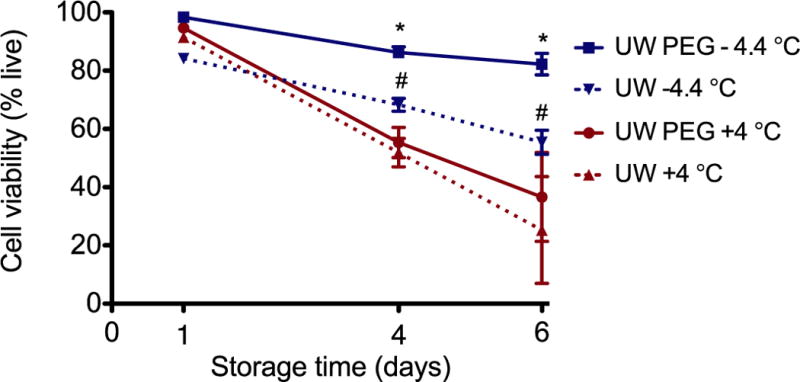
Figure 2. Cell viability after storage.

The viability was determined following an hour of recovery at 37 °C and is represented as a percentage of the viability of freshly isolated cells. (* = significantly higher than UW −4.4 °C and higher than with UW PEG at 4 °C. # = significantly higher than UW 4 °C, without PEG)
