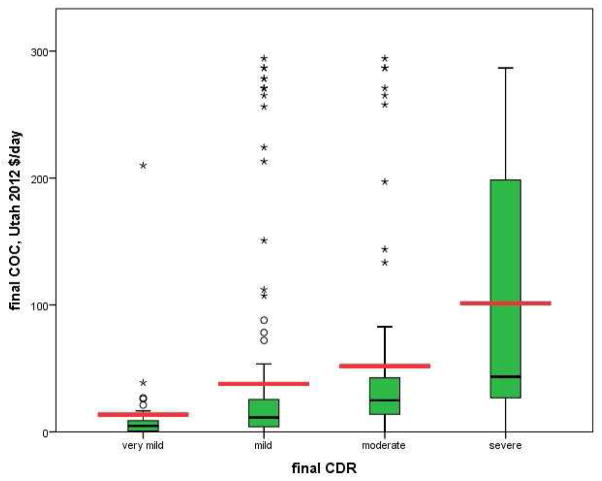
Figure 1. Average Daily Costs of informal care increase with severity of dementia.
The distribution of average daily costs of care by CDR score at final visit are depicted below in 2012 dollars (corrected using MCPI for average Utahn wages) to show the unadjusted effect of dementia severity on average daily costs of care. The heavy black lines within each “box” and the heavy red lines represent median and mean daily costs of care respectively. Lower and upper box edges represent the 25th and 75th percentiles respectively, while circles and asterisks represent outlier (1.5 * interquartile range) and far outlier (3.0*interquartile range) values respectively. While daily cost of care data were non-normally distributed (highly skewed); all means were significantly different from one another. N = 283†
† Of the 287 subjects, four were missing CDR at their final assessment and thus excluded from this figure.

