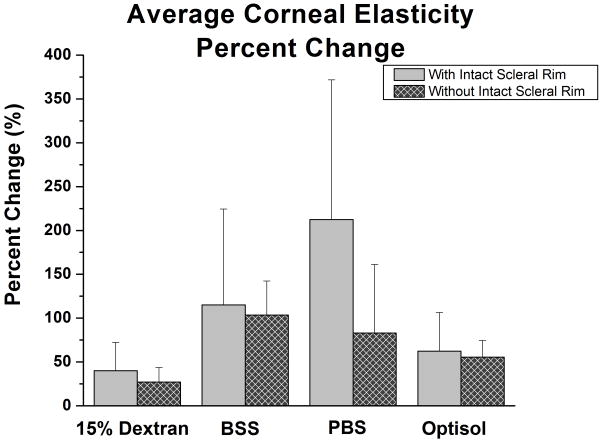
Figure 2.
Bar Graph of the Average Corneal Elasticity Percentage Change. A bar graph comparing the corneal Young’s modulus percentage changes after 120 minutes in different hydration media. Samples with the intact sclera had a greater change in Young’s modulus than samples without the intact sclera.

