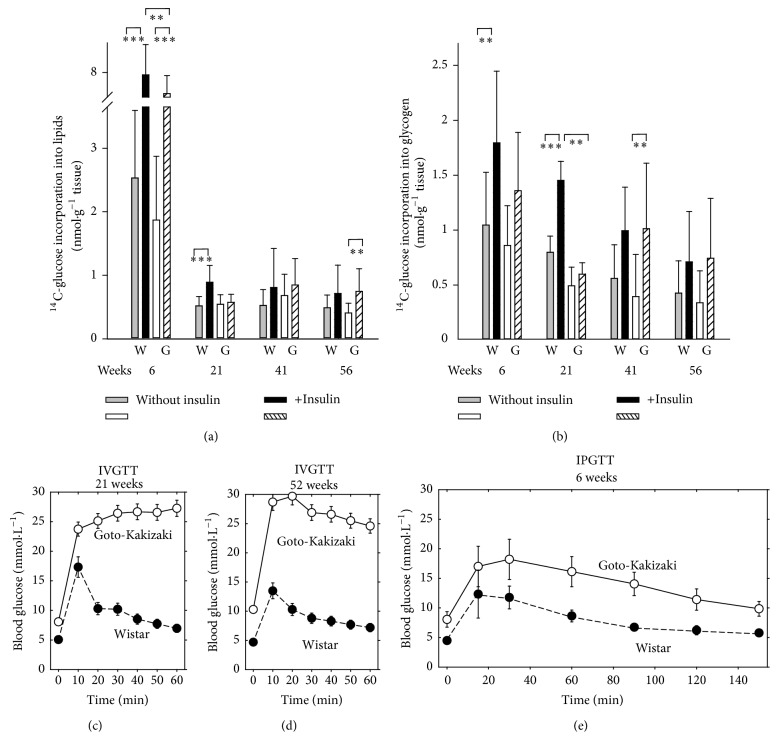
Figure 9.
In vitro insulin sensitivity (a, b) and in vivo insulin resistance (c, e) of Goto-Kakizaki rats. (a) and (b) 14C-glucose incorporation into lipids (a) of epididymal adipose tissue and into glycogen of diaphragm (b); in vitro data obtained in the absence (gray or white bars) or presence of an insulin stimulus (black or dashed bars) in four selected age groups at indicated week of age are plotted for Wistar “W” and Goto-Kakizaki rats “G.” ∗∗ANOVA yielded p < 0.05 from the following ensembles: n = 18–20 in (a) for 6 and 41 weeks, n = 9–12 in (a) for 6 and 41 weeks, and n = 8–10 in (b). (c)–(e) Intravenous glucose tolerance test “IVGTT” or (f) intraperitoneal glucose tolerance test “IPGTT” during aging of Wistar and Goto-Kakizaki rats. Blood glucose levels are indicated within the given time course after addition of glucose (see Section 2.1 for details) for a group of six rats of the given age as indicated.

