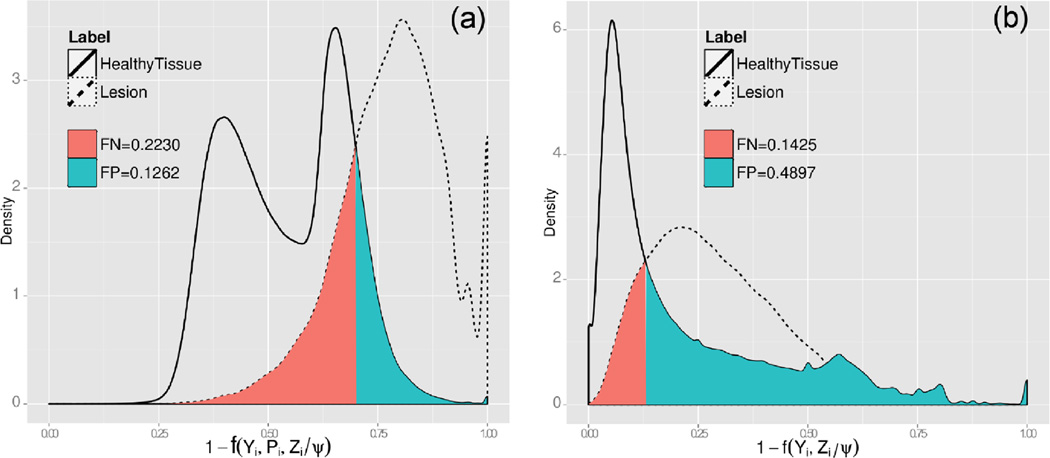
Fig. 5.
(a) Combined model lesion probability density function and (b) global model lesion probability density function. In both figures (a) and (b), the solid and dotted line plot respectively represent the lesion probability density function estimated from voxels manually labeled as MS lesions or as healthy tissue. Like in Figure 2(g), for a global intensity model the lesion probability density function for MS lesions and healthy voxels completely overlaps, which will result in increased FP.

