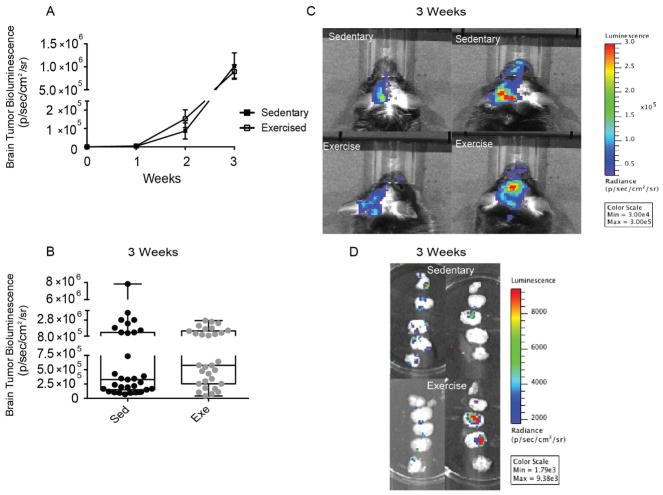
Figure 1. Exercised and sedentary mice display variation in tumor growth in vivo.
(A) Tumor progression over 3 weeks of observation. Sedentary mice closed squares, exercised mice open squares. Values are mean ± SEM. (B) Summary data of bioluminescent signal from D122-luc/GFP tumor cells in the brains of sedentary (black circles) and exercised (gray circles) mice at the 3rd (final) week of study. Each circle represents an individual mouse. Box and wisker plot. (C) Representative in vivo imaging system (IVIS) pictures of sedentary and exercised mice showing tumor growth at 3 weeks. (D) Representative IVIS images of sliced brains from sedentary and exercised mice showing tumor growth throughout the brain. (Bioluminescent signal measured in radiance, photons/second/square centimeter/square radian).

