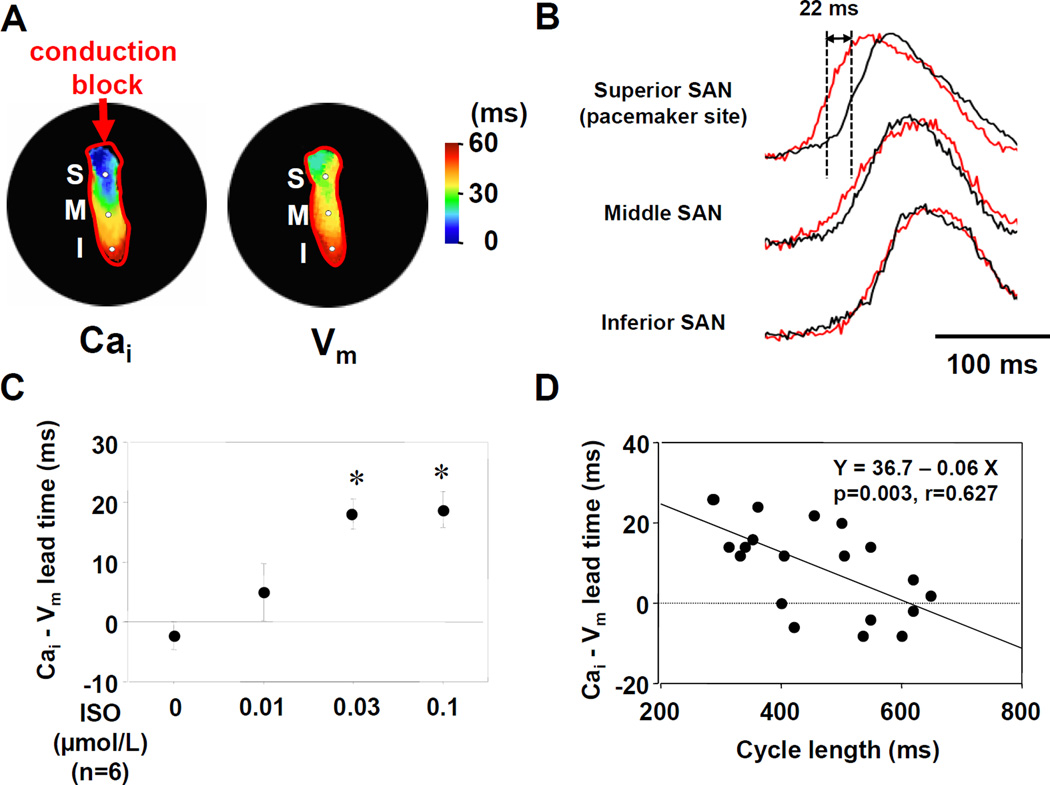
Figure 4. Effect of isoproterenol on the activation pattern of SAN.
A: Selective SAN isochronal maps during isoproterenol (ISO, 0.03 µmol/L) infusion. The left and right panels show Cai and Vm isochronal activation maps, respectively. B: Upper panel shows the magnified view of Cai (red) and Vm (black) tracings at the leading pacemaker site (superior SAN) with 0.03 µmol/L ISO. The Cai upstroke precedes the Vm upstroke (by 22 ms) at superior SAN but not at middle and inferior SAN. C: The lead time of Cai upstroke to action potential upstroke. *P<0.01 vs. baseline. D: The interaction between cycle length and the lead time of Cai upstroke at the leading pacemaker site.

